Semyon A. Grodsky, and James A. Carton
Journal of Geophysical Research, 106, 16,673-16,684, 2001
Department of Meteorology,
Computer & Space Sciences Bldg., University of Maryland College Park,
MD 20742
Abstract.
Tropical Pacific Ocean near surface currents and their momentum and temperature balances are investigated using several data sets including drifting buoy velocities and TOPEX/POSEIDON altimetry. The data sets are combined to produce surface current estimates on a uniform grid monthly for the six-year period 1993-1998 using multivariate optimal interpolation.
The analysis shows dramatic changes in current during December 1996 - August 1998 in response to the recent ENSO event. Eastward current anomalies of ~1 m/s were recorded in December 1996 in the western Pacific generated by sporadic westerly wind bursts. These equatorial anomalies reached the eastern boundary by April 1997, and in the summer of 1997 a band of strong eastward flow formed across the basin. This circulation pattern persisted until the beginning of 1998 when a westward equatorial jet appeared in January-April. Interestingly, the reversal of flow occurred prior to the restoration of the trade winds.
The timing of these events as well as results of previous dynamical studies raise questions about the relative importance of terms in the zonal momentum and temperature balances. We address the first of these questions by examining the applicability of a three-term linear zonal momentum balance on the equator. In all cases we focus on anomalies from the time-mean. Our results show that local acceleration is reasonably well balanced by the difference between zonal pressure gradient anomaly and wind-induced momentum flux. This three-term balance displays significant basin-wide variations and is consistent with the conclusion that the equatorial Pacific is not in equilibrium with local wind forcing due to the presence of propagating waves.
Examination of the temperature balance shows that at the beginning of El Niño the warming in the central Pacific is mainly supported by horizontal temperature transport, while the vertical heat exchange and transport become important in the eastern half of the equatorial Pacific during the transition from El Niño to La Niña.
1. Introduction
Although many models of air/sea interaction in the tropical Pacific assume that mixed layer temperature is controlled by diabatic mixing at its base [e.g. Suarez and Schopf, 1988]. Wyrtki [1985] proposed that the El Niño - Southern Oscillation (ENSO) cycling is governed by the mass and heat dynamics in the western Pacific warm pool with zonal transport playing a key role. Picaut et al. [1996] found that much of the monthly shift in the position of the pool of warm surface water that normally resides in the western basin can be explained by zonal advection of water within the mixed layer. The boundary between the warm pool of water to the west and the cooler water to the east defines a region of zonal convergence and subduction. The potential role of such advective processes in controlling sea surface temperature (SST) complicates our understanding of the air/sea feedback cycles leading to ENSO [Picaut et al., 1997; An et al., 1999; Jin and An, 1999]. The purpose of this paper is to reexamine the contribution of horizontal advection in momentum and heat balances in the tropical Pacific during the extreme events of 1997-8, making use of the extensive surface drifter and sea level data sets now available.
There is strong independent experimental evidence [see e.g. Johnson
and Luther, 1994; Qiao and Weisberg, 1997] that the
momentum balance on seasonal and interannual time scales is generally linear
and geostrophic away from the equator. Along the equator Yu and
McPhaden
[1999] have examined Atlas mooring data at four mooring locations and found
a three-term balance in the zonal momentum equation between local acceleration,
pressure gradient force, and wind stress whose relative strength must change
as wind intensity and direction shifts.
Recently, a suite of studies has revisited the ocean's role in regulating
SST on seasonal and interannual time scales [e.g. Köberle and
Philander
1994;
Picaut
et al. 1996; Delcroix and Picaut 1998; Moisan
and Niiler, 1998; Kessler et al. 1998;
DeWitt andSchneider
1999;
Swenson and Hansen 1999], however the conclusions have not been
uniform. Modeling studies by Köberle and Philander [1994]
and DeWitt
and
Schneider [1999] suggest that the annual cycle
of SST in the eastern basin results from entrainment of cool subthermocline
water into the mixed layer due to meridional divergence of surface waters,
while Swenson and Hansen [1999] argue that local storage
is also important. In contrast, Kessler et al. [1998] conclude that
three-dimensional temperature advection terms tend to cancel each other
and, to first order, the seasonal variation of SST can be described as
simply following the variation of net surface heat flux. It is still debatable
whether or not the same terms dominate for interannual processes such as
ENSO.
In the central and western basin the story of the heat budget is complicated as well. As mentioned above, Picaut et al. [1996] and Delcroix and Picaut [1998] argue that on interannual timescales changes of mixed layer temperature largely reflect changes in the anomalous zonal advection of water acting on the mean westward temperature gradient, while Wang and McPhaden [1999] argue additionally for the importance of surface heat flux.
The massive El Niño of 1997-8 provides an exciting opportunity to reexamine the momentum and heat balances of the tropical Pacific under extreme conditions. The story of this El Niño begins with a series of westerly wind bursts in the western basin in late 1996 [Yu and Rienecker, 1998; McPhaden, 1999; Wang and Weisberg, 2000]. These westerly wind bursts, an enhancement of the normal Madden Julian oscillation, were followed by a relaxation of the trade winds, warming of SST near the dateline in January-February 1997 and in the east by March. Instantaneous zonal velocity transects from Acoustic Doppler Current Profiler meridional-vertical sections taken during October 1996 November 1998 by Johnson et al. [2000] show a strong eastward surface current anomaly on the equator in response to the relaxing trade winds with peak velocities approaching 1m/s. As warm conditions were rapidly replaced by cold La Niña conditions and the trade winds accelerated [see McPhaden, 1999 for a discussion], the current anomalies also reversed direction, forming a westward jet with its maximum speed (>1m/s) north of the equator. Although, spatial discreetness and time sampling of this data complicate assessment of time and spatial derivatives needed to estimate the momentum and heat budgets.
Fortunately for the cause of trying to understand momentum and heat balances
during these extreme events, several new data sets have become available
in recent years. Extensive deployments of drogued surface drifters of the
WOCE Global Data, Surface Velocity Programme [Niiler et al., 1987;
Hansen
and Poulain, 1996] now provide ~3000 - 4000 buoy-days of direct
currents observations per month in the tropical Pacific [Acero-Schertzer
et al., 1997]. Much of the tropical ocean is in near-geostrophic balance
with surface pressure. Thus, satellite-based altimetry from the joint US/French
TOPEX/POSEIDON mission provides a powerful additional constraint on near-surface
velocity. Indeed Yu et al. [1995] have shown that the velocity estimates
from these two data sets are remarkably consistent. The difference between
the two we believe is due to (ageostrophic) wind-driven effects, which
Ralph
and
Niiler
[1999] show can be explained to a considerable degree by Ekman-like dynamics
except close to the equator.
The velocity analysis we use for this study we construct by combining drifter
velocity and sea level data using multivariate optimal interpolation [Carton
and Hackert, 1989; Daley, 1991]. This basic algorithm has
been extended to the equatorial ![]() -plane
based on the Kelvin Wave scaling of Picaut et al. [1989] and Menkes
et al. [1995]. To account for the wind-driven portion of currents a
simple linear friction is included to allow an Ekman-like balance on the
equator [following Lagerloef et al., 1999]. Our presentation of
results begins with a kinematic description of currents during 1996-1998
followed by a discussion of the corresponding zonal momentum and thermal
balances.
-plane
based on the Kelvin Wave scaling of Picaut et al. [1989] and Menkes
et al. [1995]. To account for the wind-driven portion of currents a
simple linear friction is included to allow an Ekman-like balance on the
equator [following Lagerloef et al., 1999]. Our presentation of
results begins with a kinematic description of currents during 1996-1998
followed by a discussion of the corresponding zonal momentum and thermal
balances.
2. Data and analysis
This study is based on four data sets, altimeter sea level, drifter velocity,
SST, and NCEP wind stress and surface heat fluxes. The TOPEX/POSEIDON altimeter
sea level is obtained from the Pathfinder version 2.1 archive [Koblinsky
et al., 1997]. This data is available with a 9.92-day repeat cycle
and 1.42-degree equatorial track spacing spanning the time period from
late-September 1992 through the end of our analysis period. After the usual
corrections for geophysical effects the sea level estimates have been averaged
into 10 latitude segments. The nominal accuracy of these estimates
when monthly averaged is 2cm [Cheney et al., 1994] while observed
sea level anomalies are at least four times that.
The drouged surface drifter currents are obtained from the WOCE/TOGA archive
at the Atlantic Ocean Marine Laboratory/NOAA. The data spans the period
1979-November, 1998. After the processing described by Hansen and
Poulain
[1996] we averaged currents into 20x30x1-month bins.
This data forms the basic velocity data set for this study. For velocity
comparisons additional moored velocity time series were obtained from Pacific
Marine Environmental Laboratory/NOAA [McPhaden et al., 1998].
The surface wind stress and the net heat flux through the ocean surface
are obtained from monthly mean NCEP/NCAR reanalysis product [Kalnay
et al.,
1996]. SST is the combined satellite AVHRR/in situ analysis
of Reynolds and Smith [1994]. For the purpose of this study the
wind stress, the heat flux, and the SST fields have been averaged into
20x30x1-month bins.
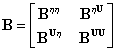
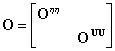
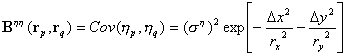
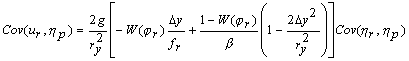
Our analysis methodology is a form of multivariate optimal interpolation
[see Daley, 1991], which is briefly summarized here. Let ![]() ,
, ![]() ,
define the analysis grid, while the spatial vectors
,
define the analysis grid, while the spatial vectors ![]() ,
, ![]() ,
and
,
and ![]() ,
, ![]() ,
are the observation station locations for sea level,
,
are the observation station locations for sea level, ![]() ,
and mixed layer velocity,
,
and mixed layer velocity, ![]() .
The analysis velocity,
.
The analysis velocity, ![]() ,
may be written as a linear combination of the weighted differences between
observations and a background estimate of sea level and velocity:
,
may be written as a linear combination of the weighted differences between
observations and a background estimate of sea level and velocity:
 ,
, (3)
(3) (4)
(4)![]() ,
(7)
,
(7)
,
 (A1)
(A1) (A3)
(A3) (A4)
(A4)
 (A5)
(A5)
Delcroix, T, and J. Picaut, Zonal displacement of the western equatorial Pacific "fresh pool", J. Geoph. Res., 103, 1087-1098, 1998.
DeWitt, D.G., and E.K. Schneider, The processes determining the annual cycle of equatorial sea surface temperature: A coupled general circulation model perspective, Mon. Wea. Rev., 127, 381-395, 1999.
Hansen, D.V., and P.-M. Poulain, Quality control and interpolations of WOCE-TOGA drifter data, J. Atmos. Oceanic Technol., 13, 900-909, 1996.
Jin, F.-F., and S.-I. An, Thermocline and zonal advective feedbacks within the equatorial ocean recharge oscillator model for ENSO, Geoph. Res. Let., 26, 2989-2992, 1999.
Johnson, E.S., and D.S. Luther, Mean zonal momentum balance in the upper and central equatorial Pacific-ocean, J. Geoph. Res., 99, 7689-7705, 1994.
Johnson, G.C., M.J. McPhaden, G.D. Rowe, and K.E. McTaggart, Upper equatorial Pacific Ocean current and salinity variability during the 1996-1998 El Niño-La Niña cycle, J. Geophys. Res., 105, 1037-1053, 2000.
Johnston, T.M.S., and M.A. Merrifield, Interannual geostrophic current anomalies in the near-equatorial Western Pacific, J. Phys. Oceanogr., 30, 3-14, 2000.
Kalnay, E., M. Kanamitsu, R. Kistler, W. Collins, D. Deaven, L. Gandin, M. Iredell, S. Saha, G. White, J. Woollen, Y. Zhu, M. Chelliah, W. Ebisuzaki, W. Higgins, J. Janowiak, K.C. Mo, C. Ropelewski, J. Wang, A. Leetmaa, R. Reynolds., R. Jenne, and D. Joseph, The NCEP/NCAR 40-year reanalysis project, Bull. Amer. Meteor. Soc., 77, 437-471, 1996.
Kessler, W.C., L.M. Rothstein, and D. Chen, The annual cycle of SST in the eastern tropical Pacific, diagnosed in an ocean GCM, J. Climate, 11, 777-799, 1998.
Kistler, R., E. Kalnay, W. Collins, S. Saha, G. White, J. Woollen, M. Chelliah, W. Ebisuzaki, M. Kanamitsu, V. Kousky, H. van den Dool, R. Jenne, and M. Fiorino, The NCEP/NCAR 50-year reanalysis, Bull. Amer. Meteor. Soc., subm. 1999.
Köberle, C., and S.G.H. Philander, On the processes that control seasonal variations of sea surface temperatures in the tropical Pacific Ocean, Tellus, 46A, 481-496, 1994.
Koblinsky, C.J., B.D. Beckley, S. Howden, L. Tsaoussi, L. Wang, and Y.M. Wang, Sea Surface Topography over the past decade observed from Satellite Altimeters, Report of the TOPEX/POSEIDON Science Working Team Meeting, International Symposium, Oct.13-17, 1997, Biarritz, France, 1997.
Lagerloef, G.S.E., G.T. Mitchum, R.B. Lukas, and P.P. Niiler, Tropical Pacific near surface currents estimated from altimeter, wind, and drifter data, J. Geophys. Res., 104, 23,313-23,326, 1999.
McPhaden, M.J., A.J. Busalacchi, R. Cheney, J-R. Donguy, K.S. Gage, D. Halpern, M. Ji, P. Julian, G. Meyers, G.T. Mitchum, P.P. Niiler, J. Picaut, R.W. Reynolds, N. Smith, and K. Takeuchi, The Tropical Ocean-Global Atmosphere observing system: A decade of progress, J. Geoph. Res., 103, 14,169-14,240, 1998.
McPhaden, M.J., Genesis and evolution of the 1997-1998 El Niño, Science, 283, 950-954, 1999.
Menkes,
C., J-P. Boulanger, and A.J. Busalacchi, Evaluation of TOPEX and basin-wide
Tropical Ocean and Global Atmosphere-Tropical Atmosphere Ocean sea surface
topographies and derived geostrophic currents, J. Geophys. Res.,
100,
25,087-25,099, 1995.
Moisan, J,R., and P.P. Niiler, The seasonal heat budget of the North Pacific: Net heat flux and heat storage rates (1950-1990), J. Phys. Oceanogr., 28, 401-421, 1998.
Niiler, P.P., R.E. Davis, and H.J. White, Water following characteristics of a mixed layer drifter, Deep Sea Res., Part A, 34, 1867-1882, 1987.
Picaut, J., S.P. Hayes, and M.J. McPhaden, Use of geostrophic approximation to estimate time-varying zonal currents at the equator, J. Geophys. Res., 94, 3228-3236, 1989.
Picaut, J., M. Ioualalen, C. Menkes, T. Delcroix, and M.J. McPhaden, Mechanism of the zonal displacements of the Pacific warm pool: Implications for ENSO, Science, 274, 1486-1489, 1996.
Picaut, J., F. Masia, and Y. du Penhoat, An advective-reflective conceptual model for the oscillatory nature of the ENSO, Science, 277, 663-666, 1997.
Qiao,
L., and R.H. Weisberg, The zonal momentum balance of the equatorial undercurrent
in the central Pacific, J. Phys. Oceanogr., 27, 1094-1119, 1997.
Ralph,
E.A., and P.P. Niiler, Wind-driven currents in the Tropical Pacific, J
.Phys. Oceanogr., 29, 2121-2129, 1999.
Reynolds,
R.W., and T.M. Smith, Improved global sea surface temperature analyses
using optimum interpolation, J. Clim., 7, 929-948, 1994.
Suarez,
M.J., and P.S. Schopf, A delayed action oscillator for ENSO, J. Atmos.
Sci., 45, 3283-3287, 1988.
Swenson,
M.S., and D.V. Hansen, Tropical Pacific ocean mixed layer heat budget:
The Pacific Cold Tongue, J. Phys. Oceanogr., 29, 69-81, 1999.
Wang,
W.M., and M.J. McPhaden, The surface-layer heat balance in the equatorial
Pacific Ocean. Part I: Mean seasonal cycle, J. Phys. Oceanogr., 29,
1812-1831, 1999.
Wang, C.Z., and R.H. Weisberg, The 1997-98 El Niño evolution relative to previous El Niño events, J. Clim., 13, 488-501, 2000.
Wyrtki, K., Water displacements in the Pacific and genesis of El Niño cycles, J. Geoph. Res., 90, 7129-7132, 1985.
Yu,
Y., W.J. Emery, and R.R.Leben, Satellite altimeter derived geostrrophic
currents in the western tropical Pacific during 1992-1993 and their validation
with drifting buoy trajectories, J. Geophys. Res., 100, 25,069-25,085,
1995.
Yu, L.A, and M.M. Rienecker, Evidence of an extratropical atmospheric influence during the onset of the 1997-98 El Niño, Geoph. Res. Let.,25, 3537-3540, 1998.
Yu, X.R., and M.J. McPhaden, Dynamical analysis of seasonal and interannual variability in the equatorial Pacific, J. Geophys. Res.,29, 2350-2369, 1999.
Figure captures
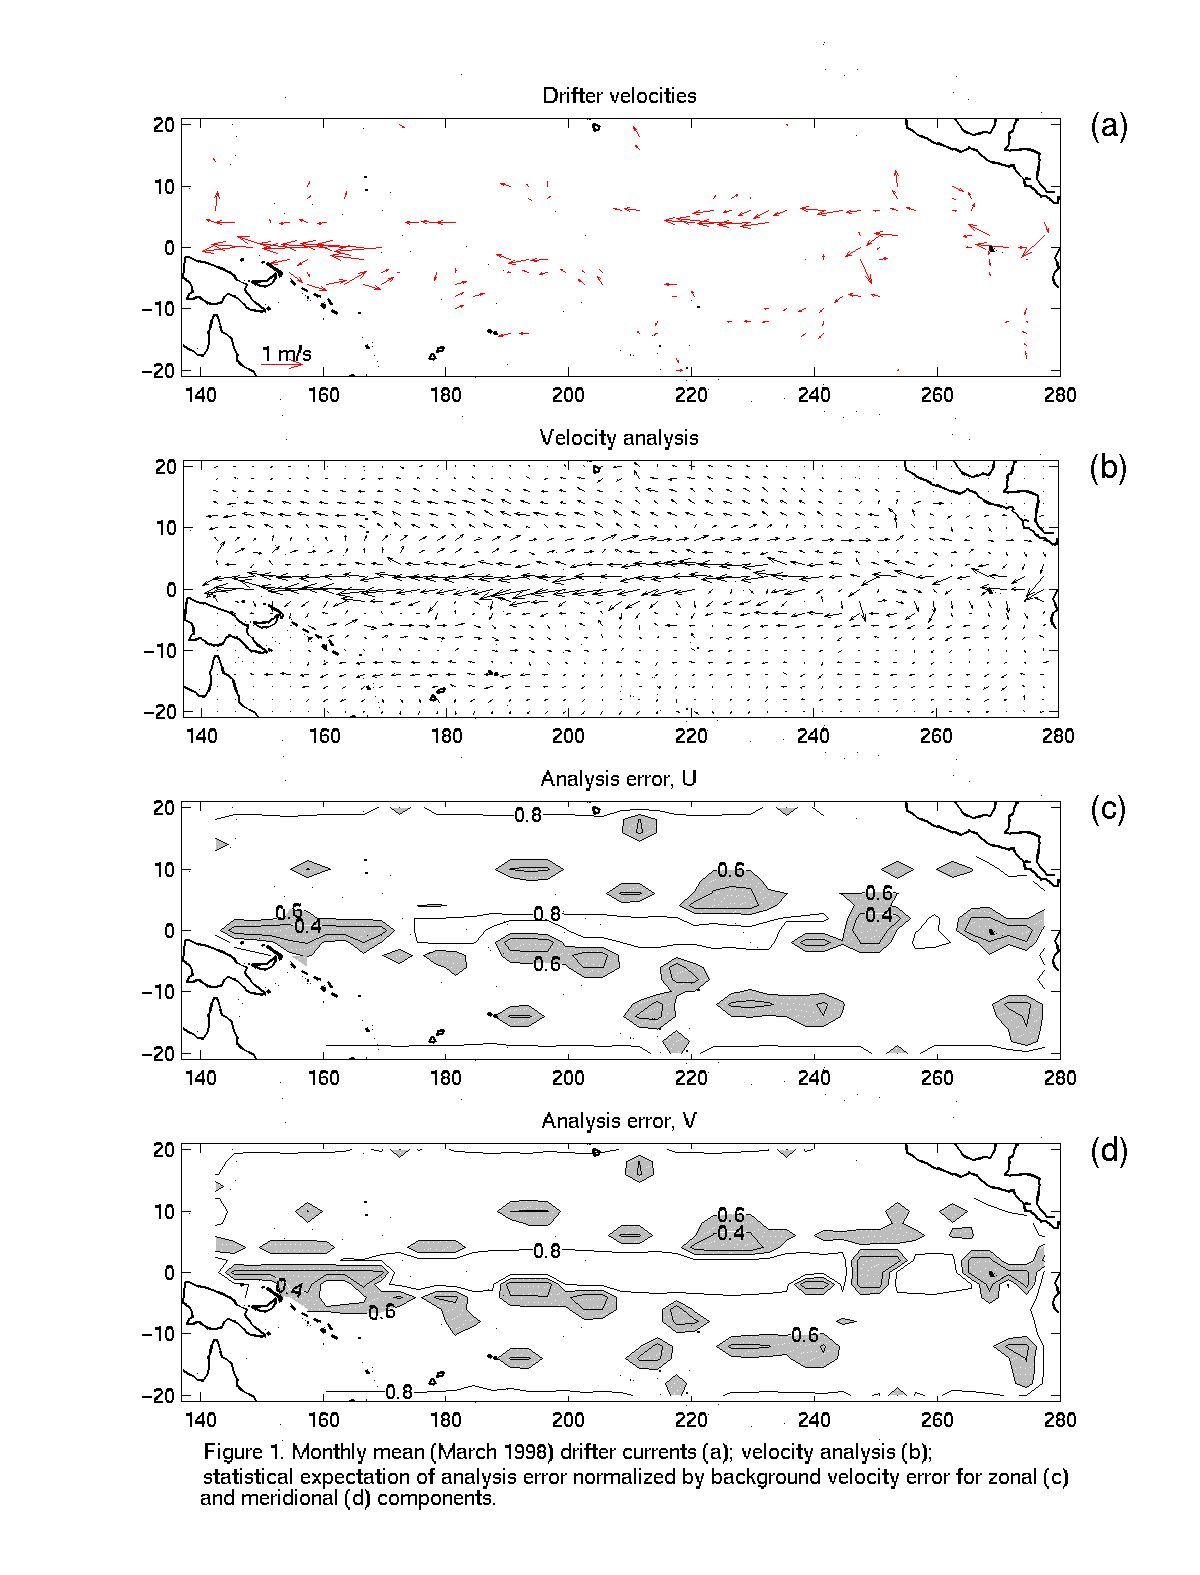
Figure 1. Velocity for March 1998: (a) Drifter velocity observations; (b) analysis velocity; (c) normalized zonal velocity error; (d) normalized meridional velocity error. The expected analysis error variance for each velocity component calculated following Daley [1991] was normalized by the background error variance.
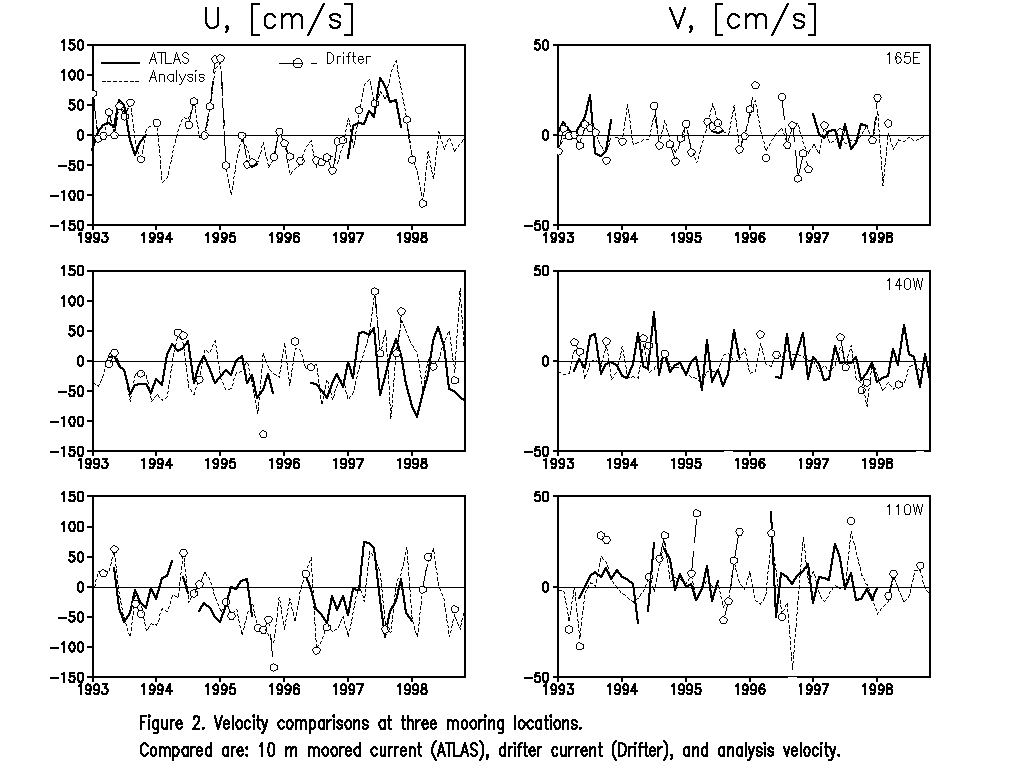
Figure 2. Velocity comparisons at three moorings locations. Three estimates are compared, 10 m moored currents (ATLAS), surface drifter observations (Drifter), and analysis velocity.
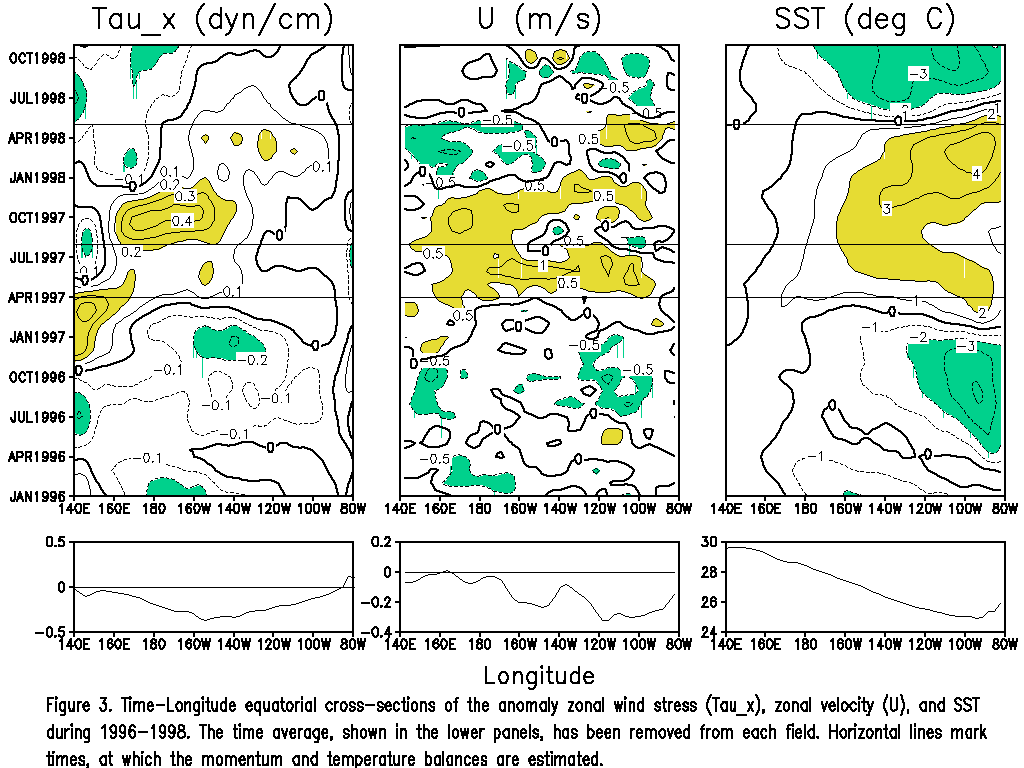
Figure 3. Time-longitude equatorial cross-section of zonal wind stress, surface velocity and SST during 1996-1998. The time average, shown in the lower panels, has been removed from each field. Horizontal lines mark the times for which the estimates of the upper ocean momentum and temperature balances are shown in Figures 6 and 8.
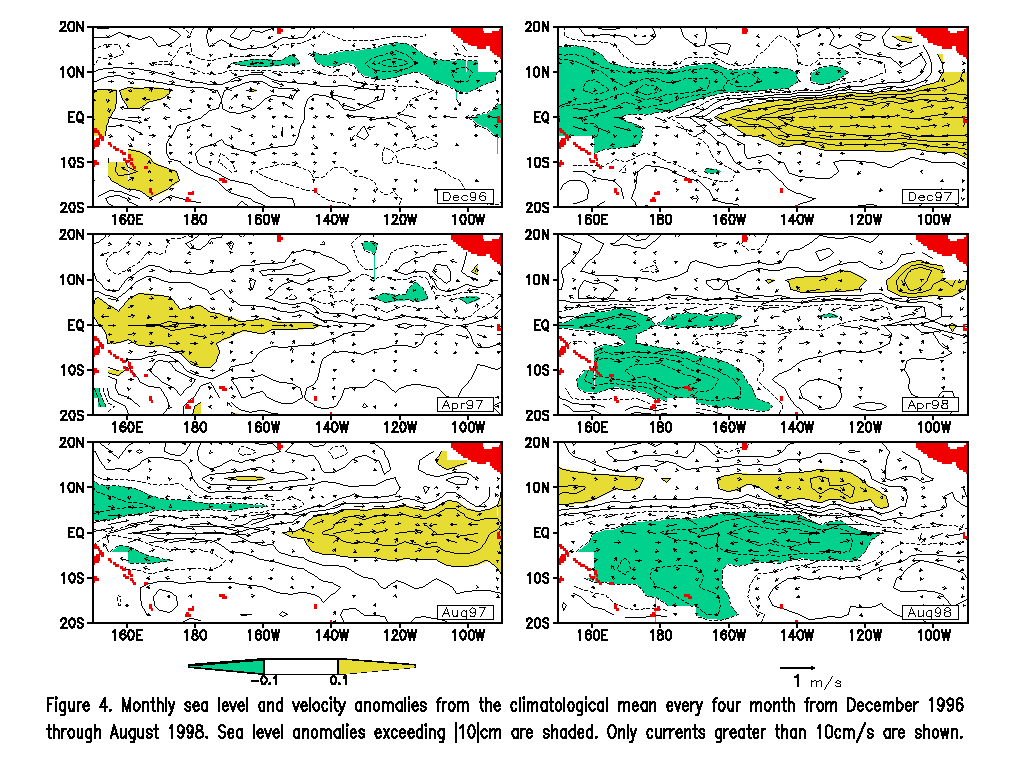
Figure 4. Monthly sea level and velocity anomalies from the climatological mean every four months from December 1996 through August 1998. Contour interval is 5 cm. Sea level anomalies exceeding |10cm| are shaded. Only currents greater than 10cm/s are shown.
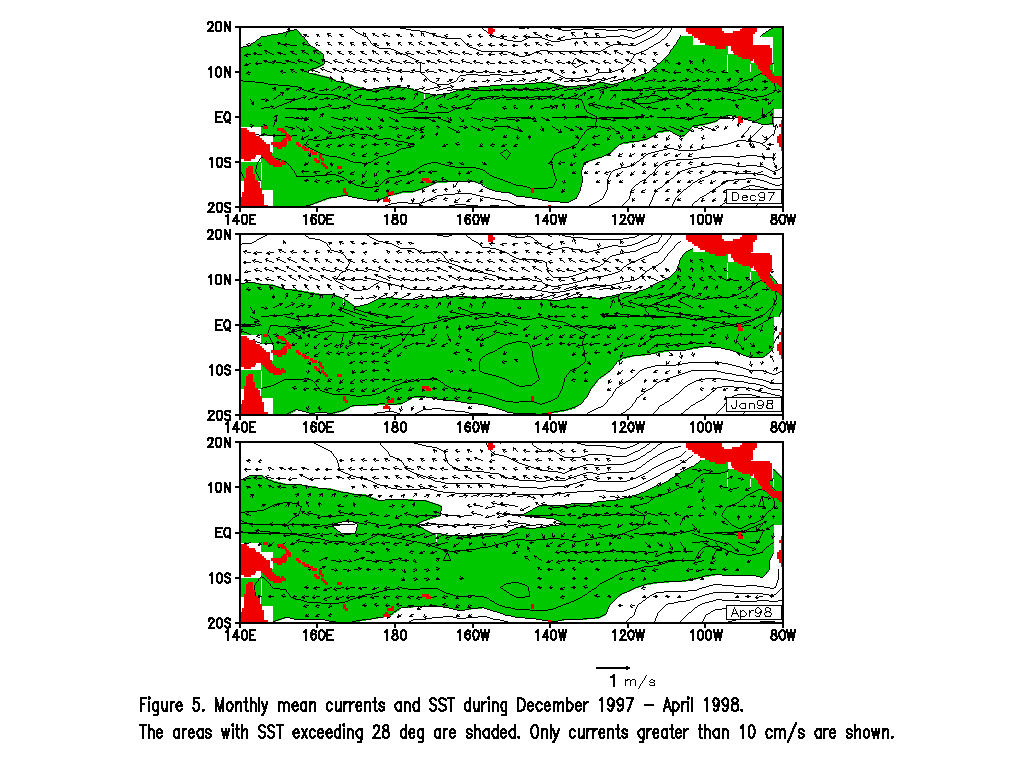
Figure 5. Monthly mean currents and SST during December 1997 - April 1998. Contour interval is 10C. The areas with SST exceeding 280C are shaded. Only currents greater than 10cm/s are shown.
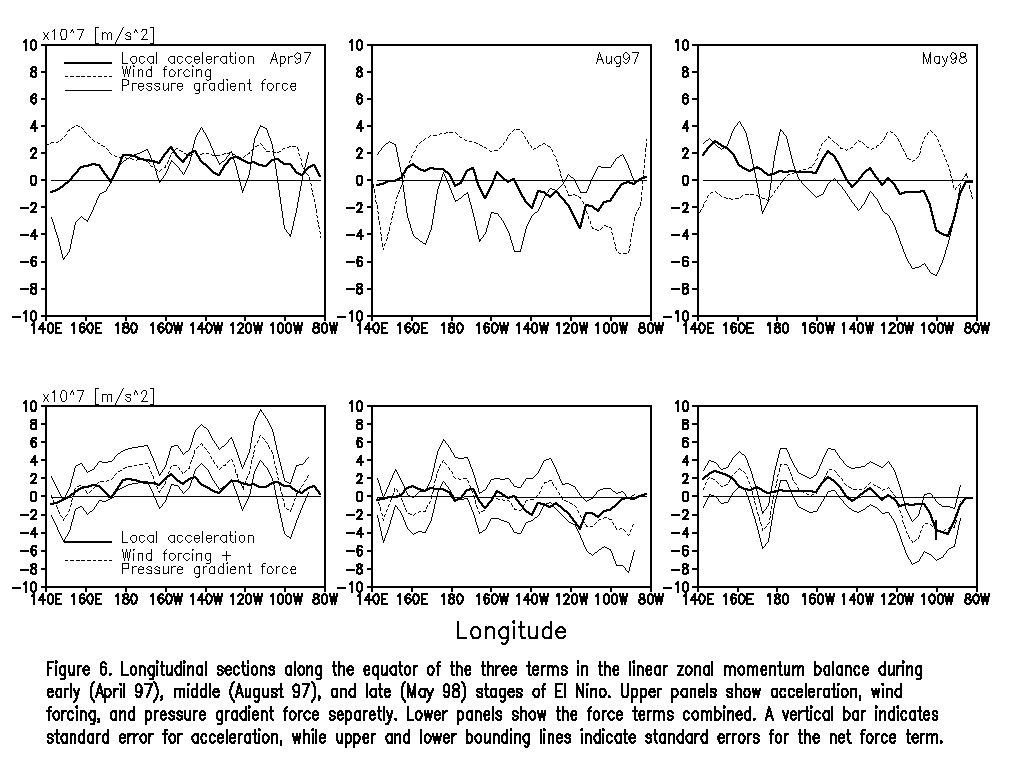
Figure
6. Longitudinal sections along the equator of the three terms in the
linear zonal momentum balance during the early, middle, and late stages
of El Niño. Upper panels show acceleration (![]() ),
zonal wind stress (
),
zonal wind stress (![]() ),
and pressure gradient force (
),
and pressure gradient force (![]() )
separately. Lower panels show the wind stress and pressure gradient terms
combined (
)
separately. Lower panels show the wind stress and pressure gradient terms
combined (![]() ).
A vertical bar indicates standard errors for acceleration, while upper
and lower thin bounding lines indicate standard errors for
).
A vertical bar indicates standard errors for acceleration, while upper
and lower thin bounding lines indicate standard errors for ![]() .
.
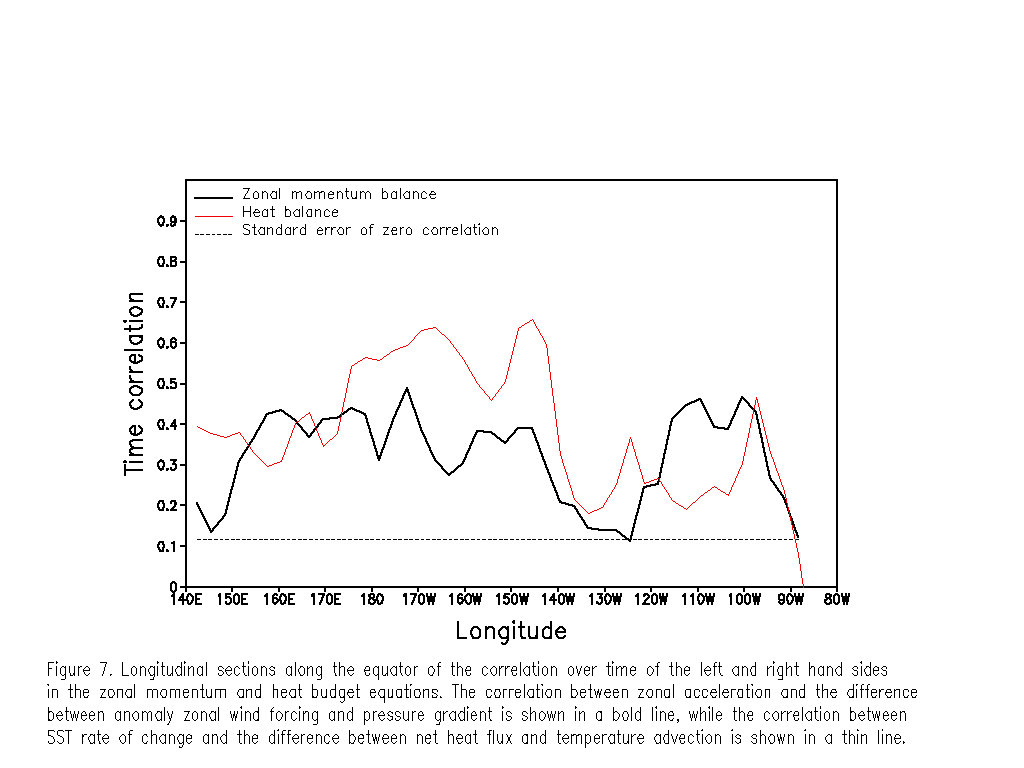
Figure
7. Longitudinal sections along the equator of the correlation over
time of the left and right hand sides in the zonal momentum and heat budget
equations. The correlation between zonal acceleration and the difference
between anomaly zonal wind stress and anomaly zonal pressure gradient is
shown in a bold line, while the correlation between SST rate of change
and the difference between net heat flux and temperature advection is shown
in a thin line.
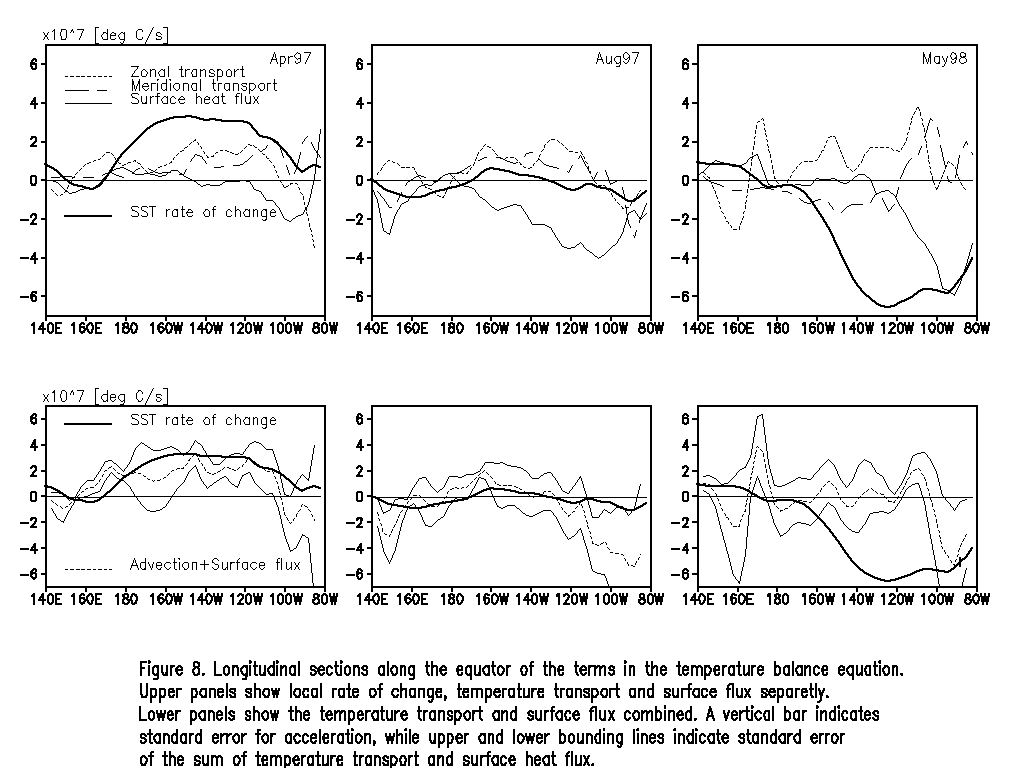
Figure
8. Longitudinal sections along the equator of the terms in the temperature
balance equation during the same three months as in Fig. 6. Upper panels
show the rate of change of SST (![]() ),
zonal (
),
zonal (![]() )
and meridional (
)
and meridional (![]() )
advection, and surface heat flux (
)
advection, and surface heat flux (![]() )
separately. Lower panels show heat advection and heat flux terms combined.
Standard errors are shown with vertical bar for SST rate of change, and
with upper and lower thin bounding lines for the term combining the effects
of advection and surface heat flux. Note, that an SST rate of change of
10-7 0C/s corresponds to heat flux of 28 W/m2
and 10 W/m2 for the mixed layer thickness of H=70 m and
H=25
m, typical of the central and eastern parts of the basin, respectively.
)
separately. Lower panels show heat advection and heat flux terms combined.
Standard errors are shown with vertical bar for SST rate of change, and
with upper and lower thin bounding lines for the term combining the effects
of advection and surface heat flux. Note, that an SST rate of change of
10-7 0C/s corresponds to heat flux of 28 W/m2
and 10 W/m2 for the mixed layer thickness of H=70 m and
H=25
m, typical of the central and eastern parts of the basin, respectively.