INTERANNUAL-TO-DECADAL AIR-SEA INTERACTIONS IN THE TROPICAL ATLANTIC REGION
Department of Meteorology
University of Maryland
College Park, MD 20742-2425
Climate variability in the tropical Atlantic may result from a variety of internal (i.e. anomalous diabatic heating, momentum and thermal transients) and external causes. It is our interpretation that local air-sea interactions are at the heart of the main modes of variability in the region. Partial results of our research of interannual climate variability in the tropical Atlantic region will be shown.
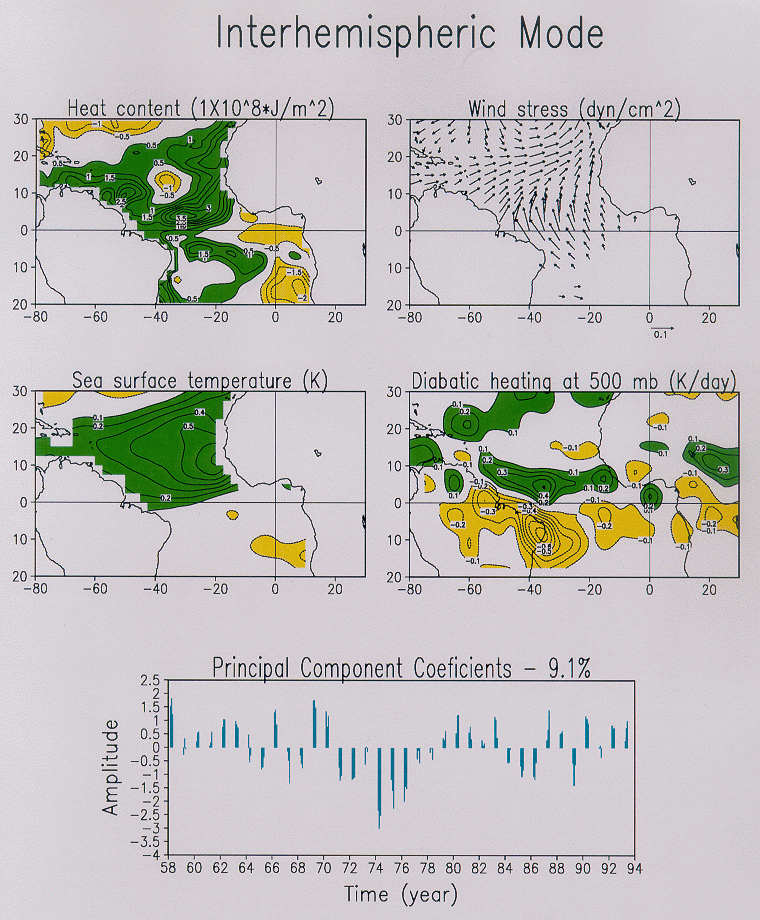
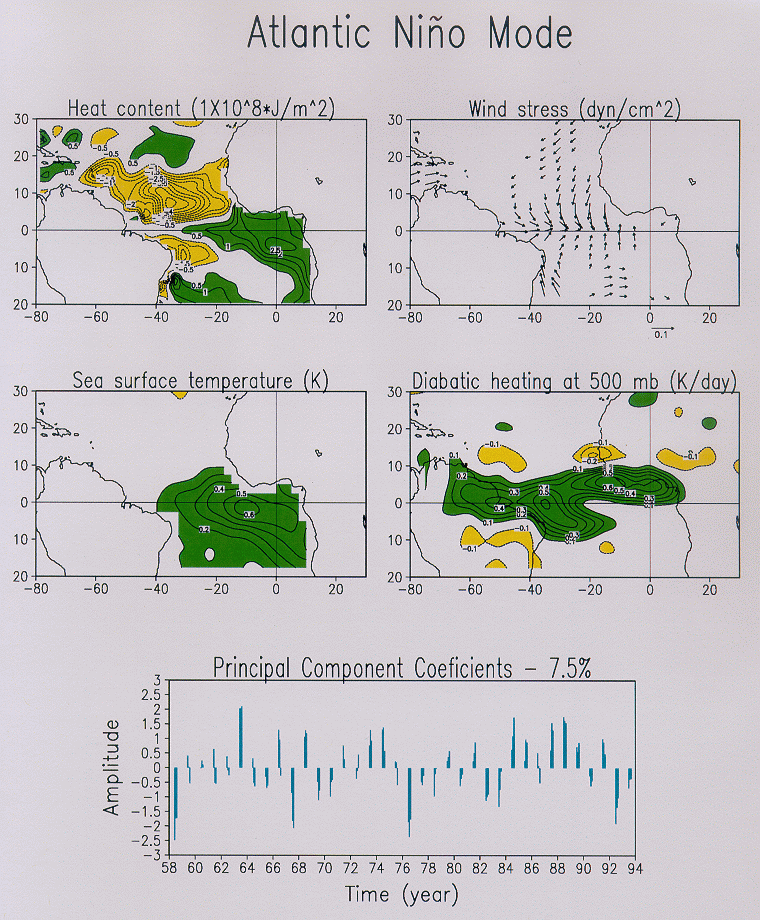
The use of a rotated principal component analysis to search for coherent variations in five key parameters (sea surface temperature, winds, atmospheric diabatic heating, and ocean heat content ) during the 1958/01-1993/12 period gives an expanded view of two main tropical modes (Ruiz-Barradas et al., 2000). While the first mode has a midlatitude connotation the second and third modes are tropical in their nature. The second mode is the Atlantic Nino mode with anomalous sea surface temperature and anomalous heat content in the eastern equatorial basin. Wind stress weakens to the west of anomalously warm water, while convection is shifted south and eastward. The Atlantic Nino mode, as shown in figure 1, has maximum amplitude in northern summer. The third mode is associated with an interhemispheric gradient of anomalous sea surface temperature and a dipole pattern of atmospheric heating. In its positive phase anomalous heating occurs over the warmer Northern Hemisphere with divergence aloft shifting convection to the north and west of the equator and intensifying the subtropical jet stream, while descending motion occurs on the western side of the Southern Hemisphere. Surface and subsurface structures in the ocean are controlled by surface winds. The interhemispheric mode, as shown in figure 2, has maximum amplitude in northern spring.
Exploration of the local mechanisms promoting air-sea interactions needs the use of a coupled model. However, a first uncoupled modeling study can be conducted to explore the atmospheric internal and external causes of variability in the sector. For this purpose we use a steady linear primitive equation model of the atmosphere. This model is forced by anomalous diabatic heating as well as momentum and thermal transients (from NCEP reanalysis monthly data 1958-1993) in a grid with 2.5 degrees of meridional resolution and 30 wave numbers in the zonal direction. Through historical sensitivity runs is found that diabatic heating at lower levels (Pressure>=780 mb) is the most important contributor to the tropical zonal and meridional wind anomalies. It is also found that surface wind and surface air pressure patterns of both of the interannual modes are the result of anomalous diabatic heating at low and middle levels. Thus the distribution of diabatic heating of these modes works toward the enhancement of their sea surface temperature anomalies suggesting the existence of positive feedbacks in the region. This can be seen from figure 3 and figure4. The hydrostatic response of mixed layer pressure to anomalous sea surface temperature of the modes also acts to reinforce these patterns. In contrast, upper level winds are determined mainly by heating above 350 mb.
The remote effect of El Nino-Southern Oscillation (ENSO) is also explored. Here we identify the diabatic heating pattern in the Atlantic sector associated with an index of ENSO then examine the model response to this forcing. We find that the associated anomalous diabatic heating at intermediate levels is the major contributor to the resulting near-surface wind circulation, which resemble the pattern associated with the interhemispheric mode. This diabatic heating pattern is the ultimate result of two mechanisms that together can promote warming in the northern tropics and a shift in the position of the Intertropical Convergence Zone: changes in intensity of the Walker circulation, and intrusion at near-surface levels of sea level pressure anomalies in the northern tropics. This scenario, as seen in figure 5, seems to set up conditions for cross-equatorial southeasterly wind anomalies and southwesterly anomalies that reduce the normal northeasterly trades. Although momentum and thermal transients do not play a fundamental role forcing the local circulation in the tropical Atlantic, transients are very important for the intensification of the link between the tropical Pacific and Atlantic basins.
Acknowledgements
The authors are grateful to Dr. C. Chung for his assistance with the
principal component analysis, and to Dr. Eric DeWeaver for diagnosing the
diabatic heating from the NCEP reanalysis. AR-B was supported by a scholarship
from the National University of Mexico and the previous results are part
of his Ph.D. thesis. JAC was supported by the National Science Foundation
(OCE9530220) and NASA (NASA960912). SN was supported by NOAA PACS grant
NA76GP0479, and NSF grant ATM9422507. Results from the empirical analysis
will appear in the referred paper.
References

Figure 1. Anomalies of the first rotated mode using June, July and August
only. Upper left: hc'(10^8 J/m^2), upper right: tau'(dyn/cm^2); middle
left: sst'(K), middle right: q' at 500 mb (K/day); lower: PCC time series.
Only wind stress anomalies larger than 0.02 dyn/cm^2 are shown. Explained
variance is 7.5%. Green(dark)/Yellow(light) shading denote positive/negative
anomalies.
Figure 2. Anomalies of the first rotated mode using March, April and May only. Upper left: hc'(10^8 J/m^2), upper right: tau'(dyn/cm^2); middle left: sst'(K), middle right: q' at 500 mb (K/day); lower: PCC time series. Only wind stress anomalies larger than 0.02 dyn/cm^2 are shown. Explained variance is 9.1%. Green(dark)/Yellow(light) shading denote positive/negative anomalies.
Figure 3. Observed and simulated eddy anomalies of sea level pressure (mb) and 1000 mb winds (m/s) and divergence (10^-7/s) and winds (m/s) at 200 mb for the Atlantic Nino mode. Simulation is made with the linear PE model and forcings are only in the tropical Atlantic sector (80W-30E, 20S-20N). Upper panels a) and b) show the regressed fields from NCEP reanalysis data. Middle panels c) and d) show the simulation when diabatic heating is the only forcing while lower panels e) and f) display the simulation when diabatic heating is restricted to the lower atmosphere (P>=~780 mb). Green(dark)/yellow(light) shading denotes positive/negative anomalies.
Figure 4. Observed and simulated eddy anomalies of sea level pressure (mb) and 1000 mb winds (m/s) and divergence (10^-7/s) and winds (m/s) at 200 mb for the Interhemispheric mode. Simulation is made with the linear PE model and forcings are only in the tropical Atlantic sector (80W-30E, 20S-20N). Upper panels a) and b) show the regressed fields from NCEP reanalysis data. Middle panels c) and d) show the simulation when diabatic heating is the only forcing while lower panels e) and f) display the simulation when diabatic heating is restricted to the lower atmosphere (P>=~780 mb). Green(dark)/yellow(light) shading denotes positive/negative anomalies.
Figure 5. Observed and simulated eddy anomalies of sea level pressure
(mb) and 1000 mb winds (m/s) and divergence (10^-7/s) and winds (m/s) at
200 mb. Upper panels a) and b) display the regressed fields against the
March, April, May months of Nino-4 index. Middle panels c) and d) show
the simulation when diabatic heating, transients and anomalous lower boundary
conditions are restricted to the tropical Pacific (130E-90W, 20S-20N) and
diabatic heating is additionally restricted to the middle atmosphere (~430
mb<=P<=~690 mb); lower panels e) and f) show a similar simulation
to that in middle panels but middle diabatic heating in the tropical Atlantic
is considered too. Green(dark)/Yellow(light) shading denotes positive/negative
anomalies.