
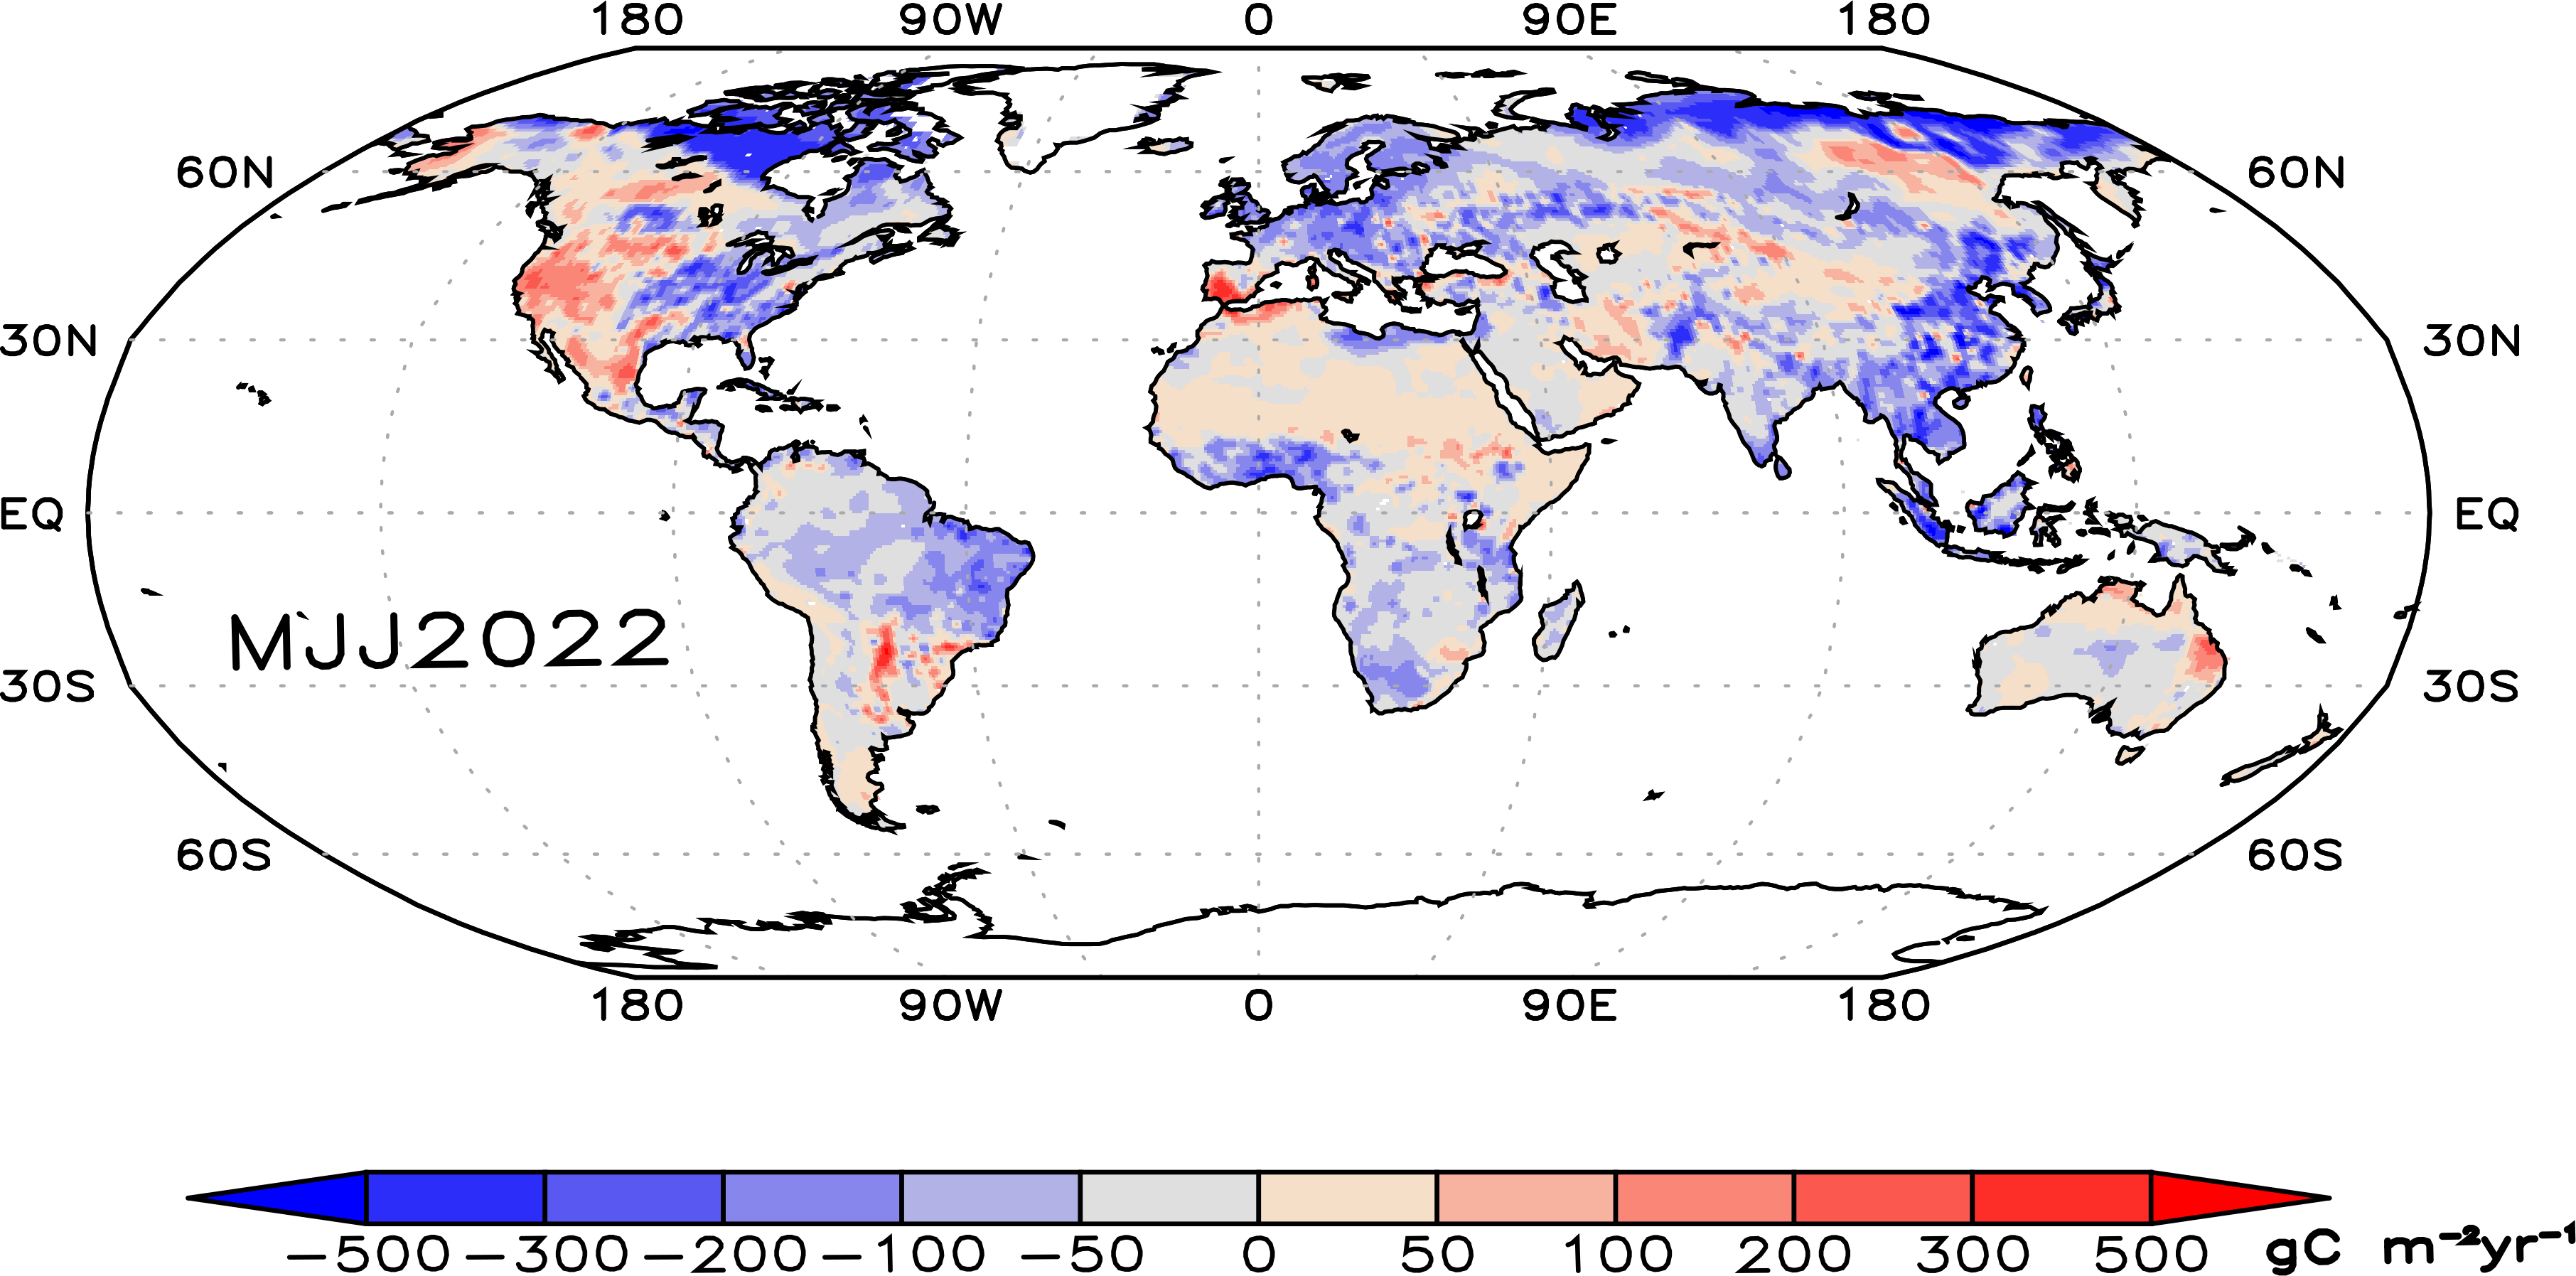
Land-to-atmosphere carbon flux anomalies-the latest three months (D-Dec/J-Jan/F-Feb/M-Mar/A-Apr/M-May/J-Jun/J-Jul/A-Aug/S-SON/S-Sep/O-Oct/N-Nov), basically 1-2 month lag. See also the last four seasons.
Summary
The El Nino of 2015-2016 has led to a increase in terrestrail carbon flux to the atmosphere. This source can be attributed to wide spread positive flux anomalies across much of the tropics, most notably in the tropical South America including the Amazon, Indonesia, Northeast Australia, and parts of southern Africa. Significant sinks are seen in some extra-tropical regions including the Sahel, southern US, and eastern China. Corresponding patterns are seen in NPP, precipitation, soil moisture and temperature.
The growth rate of the global atmospheric CO2 index, less fossil fuel emissions and ocean-atmosphere carbon flux has also been increasing since mid-2015.
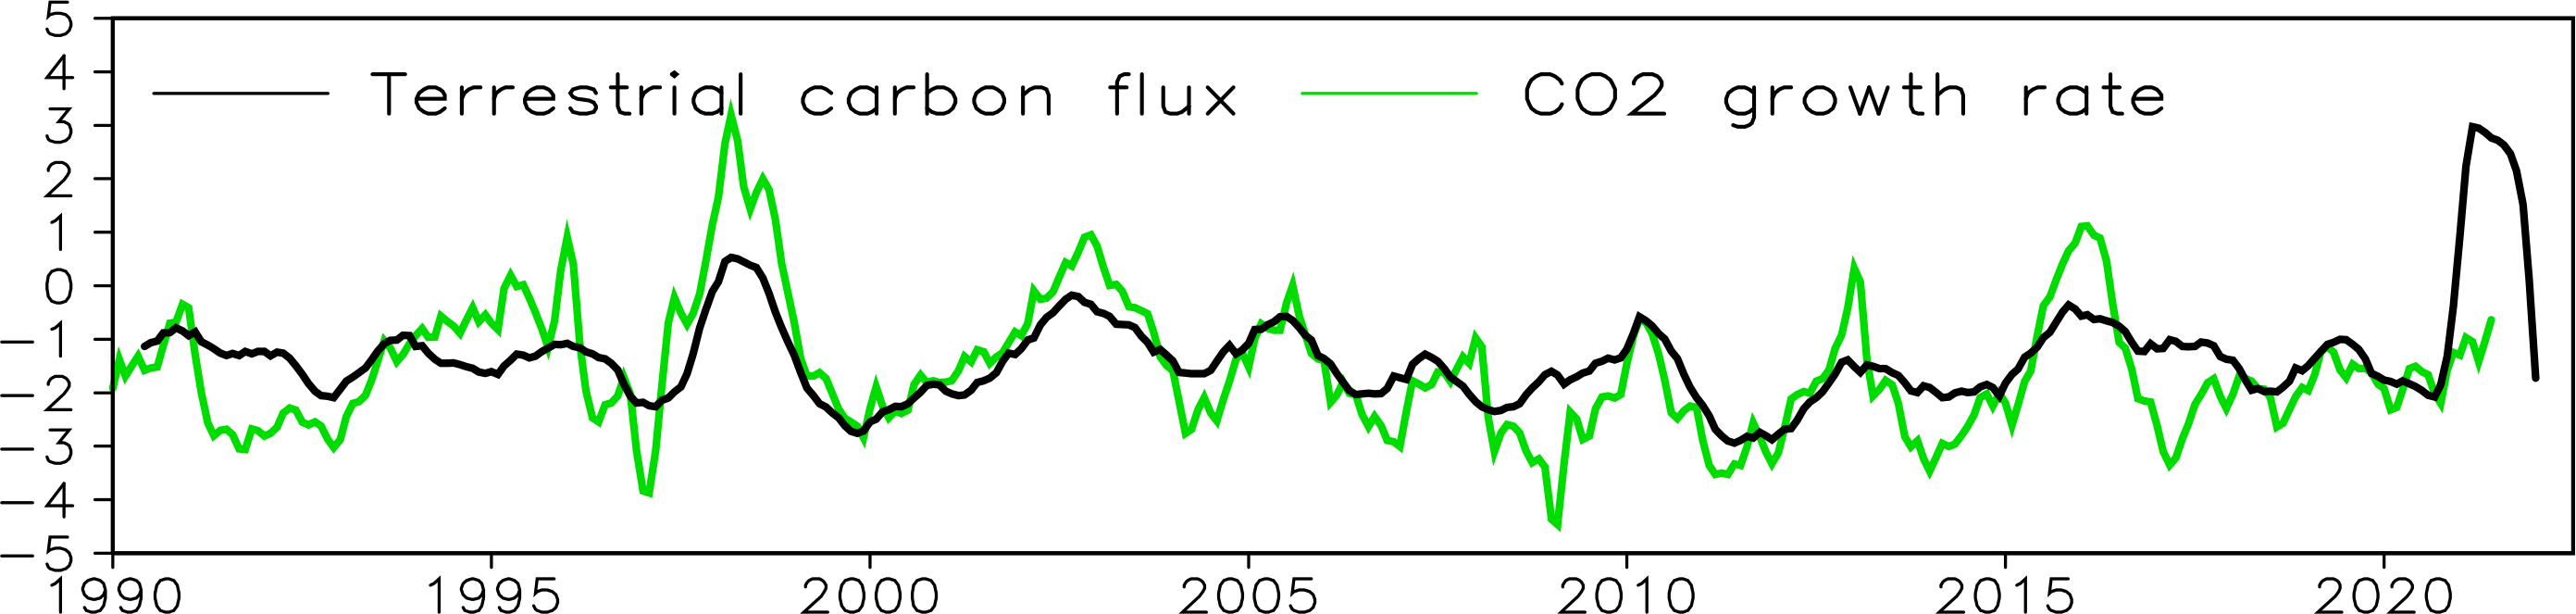 Global total land-to-atmosphere carbon flux (GtC yr-1) from the VEGAS model and the growth rate of observed global CO2 index minus fossil fuel emission and ocean carbon flux. The time series are smoothed with 12-month running mean. (Source: the VEGAS model from Zeng et al., 2005 and 2014; global CO2 index is from NOAA/ESRL; Fossil fuel emissions and ocean fluxes are based on the Global Carbon Project)
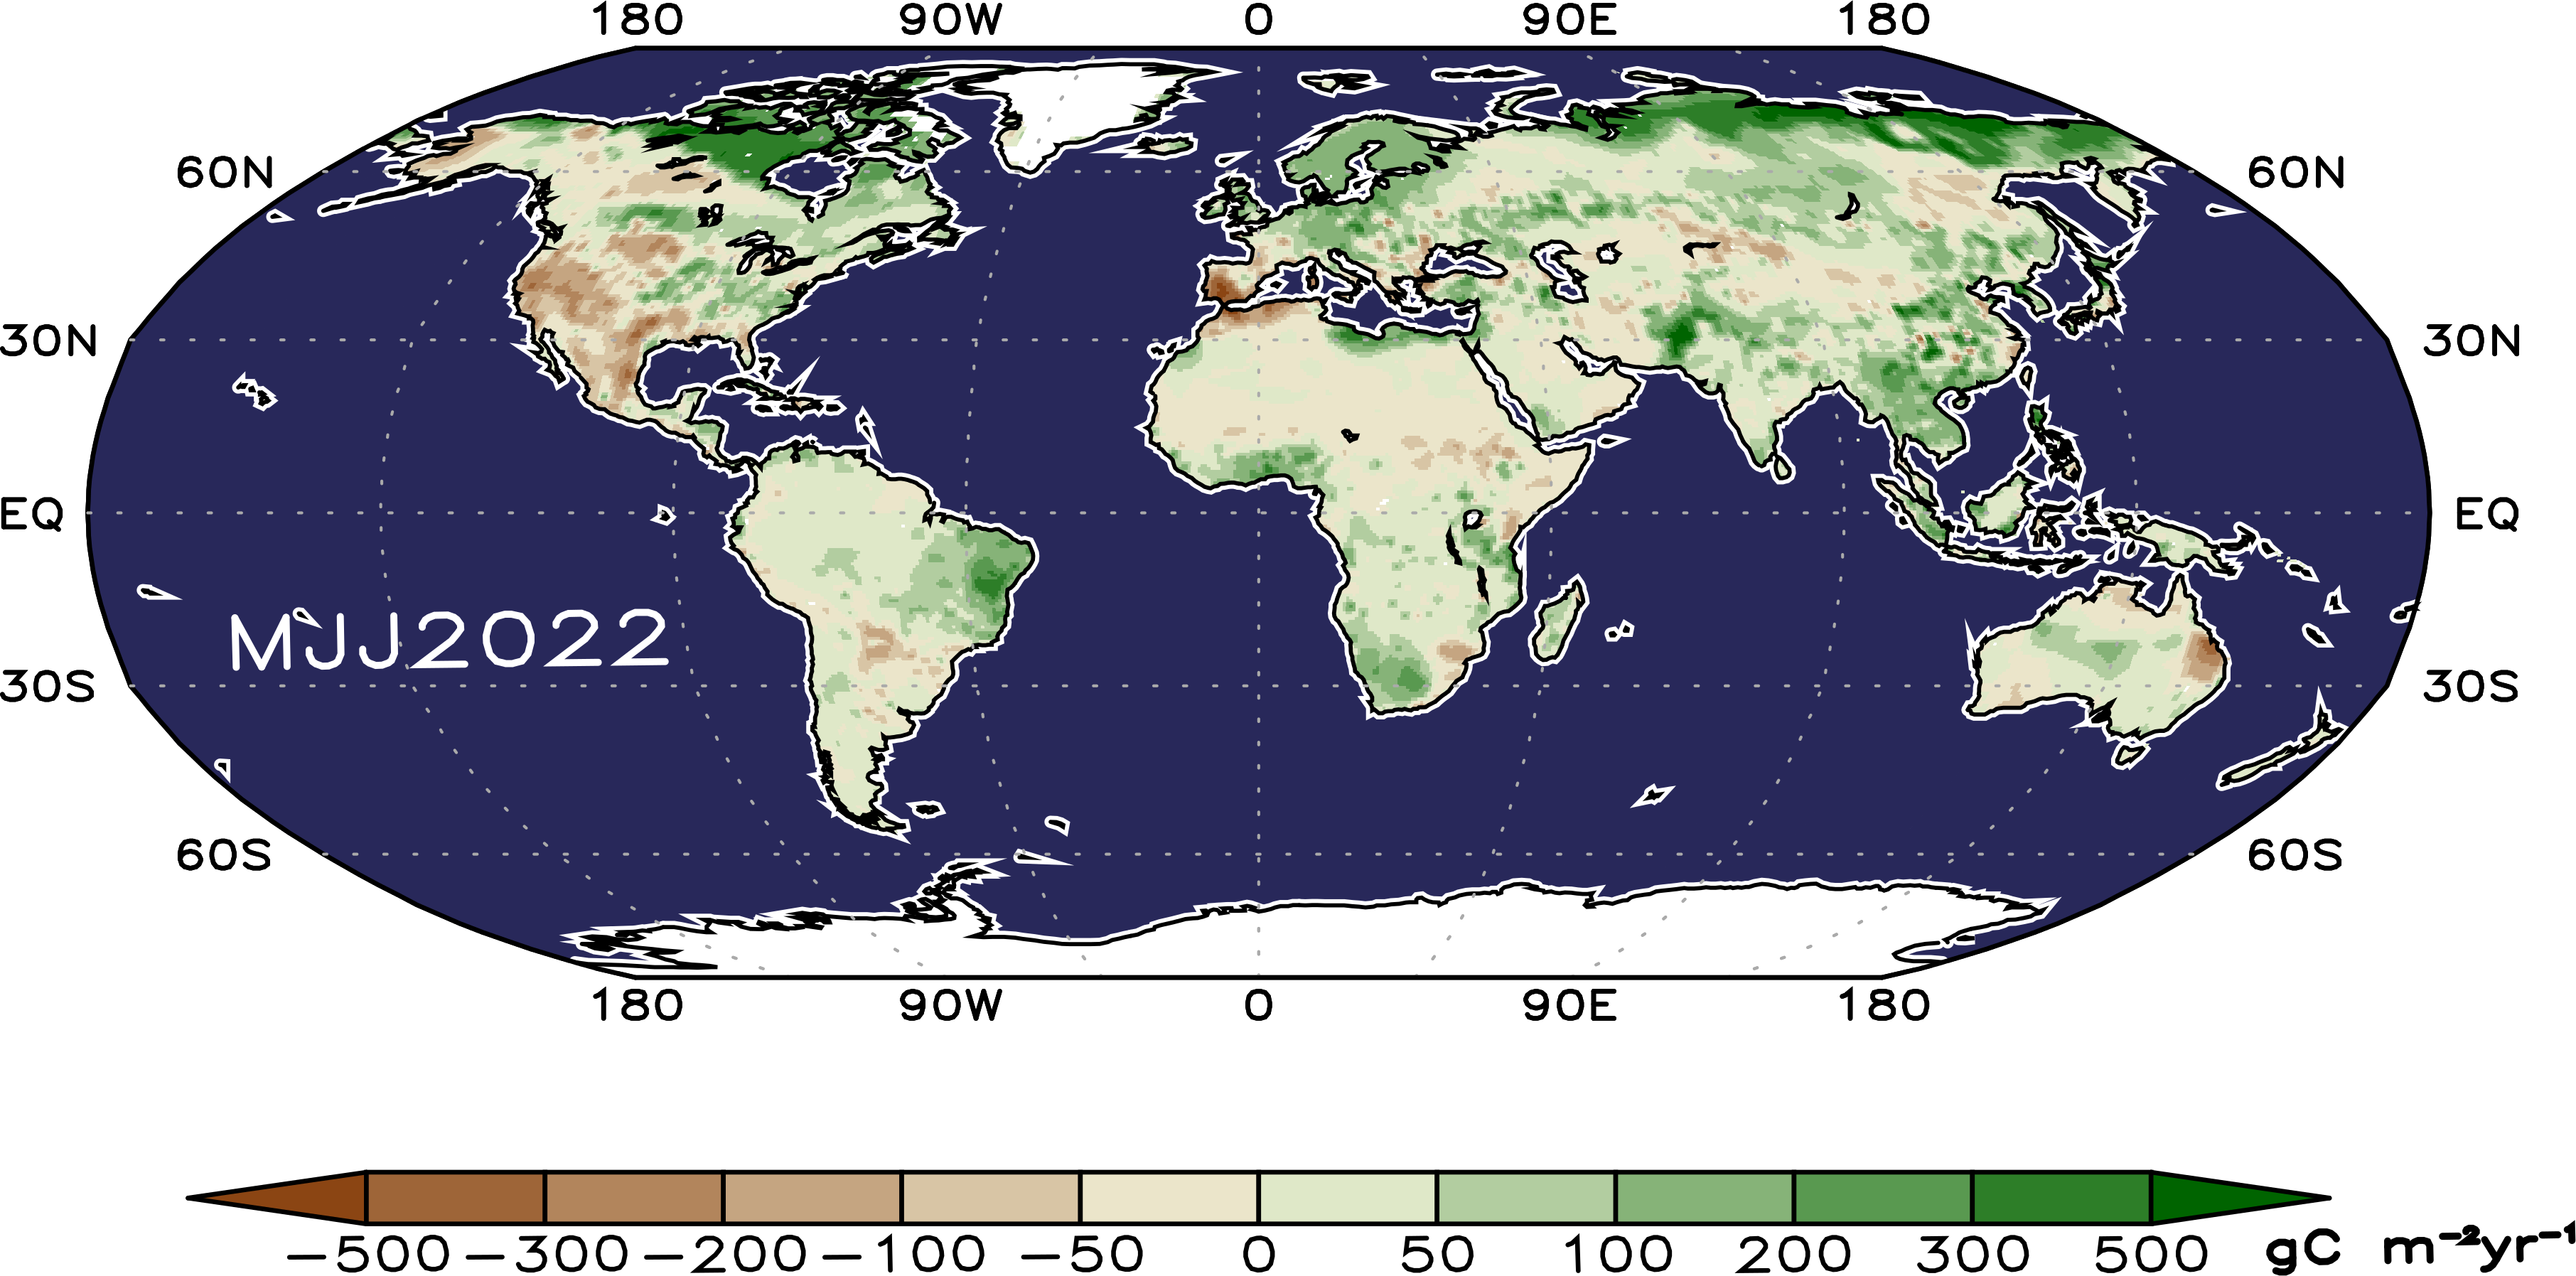 Net Primary Production (NPP) spatial anomaly-the latest three months and last four seasons. |
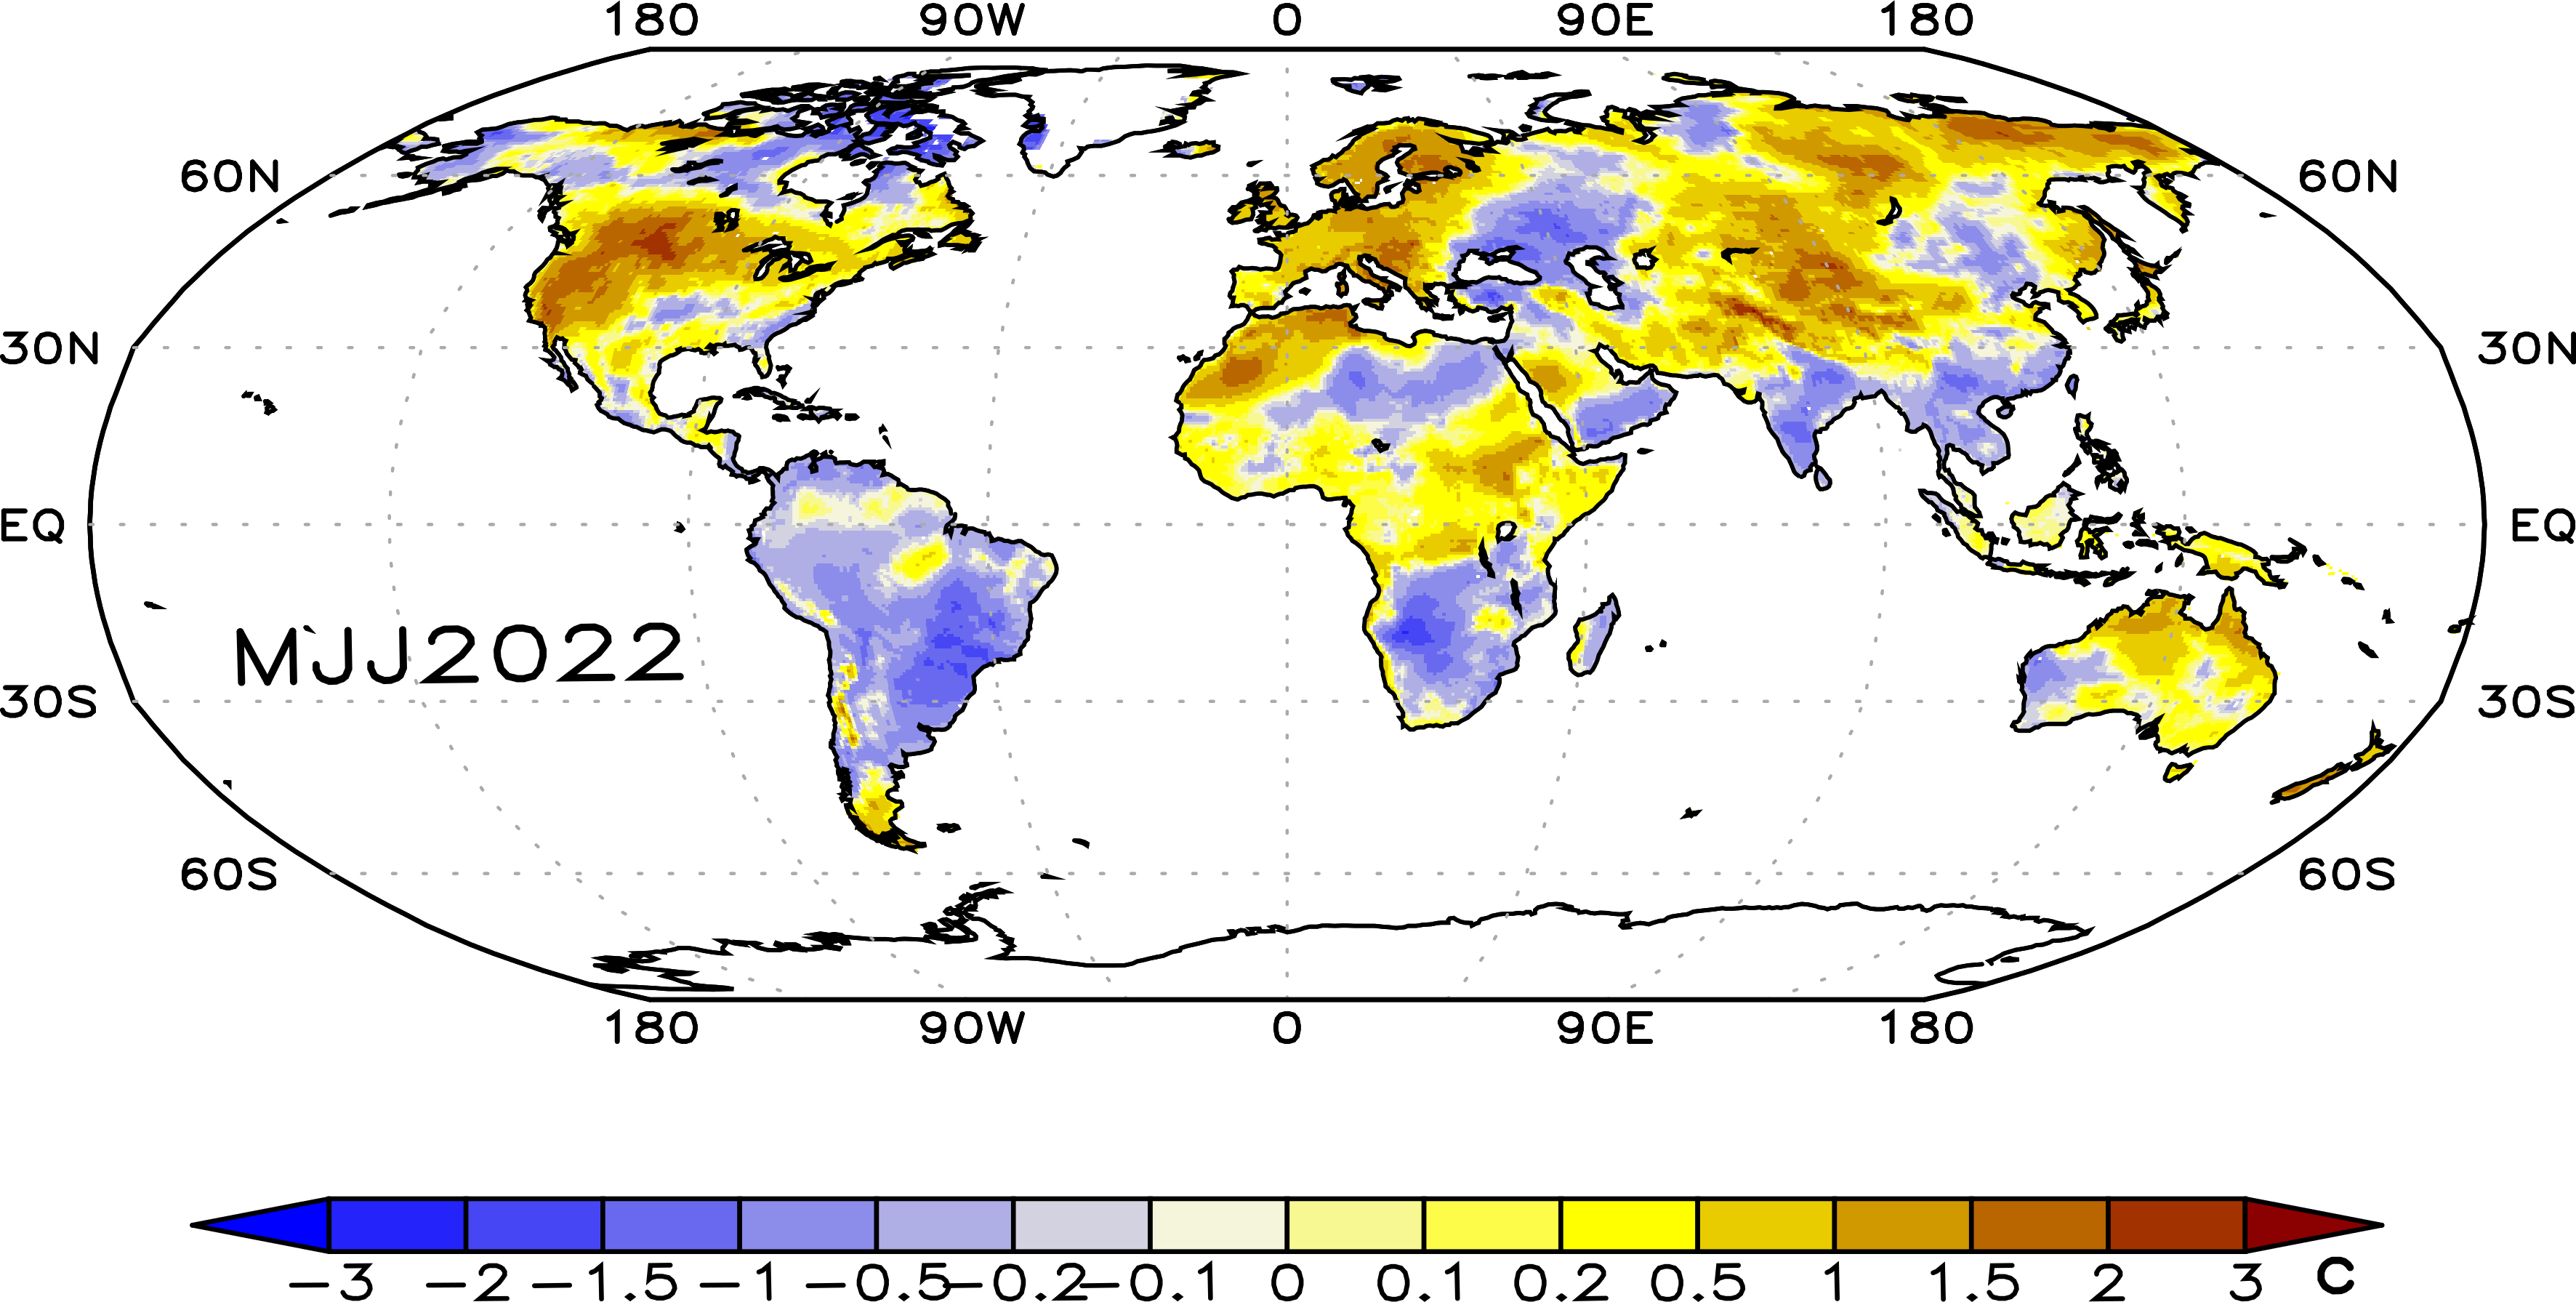 Temperature spatial anomaly-the latest three months and last four seasons. |
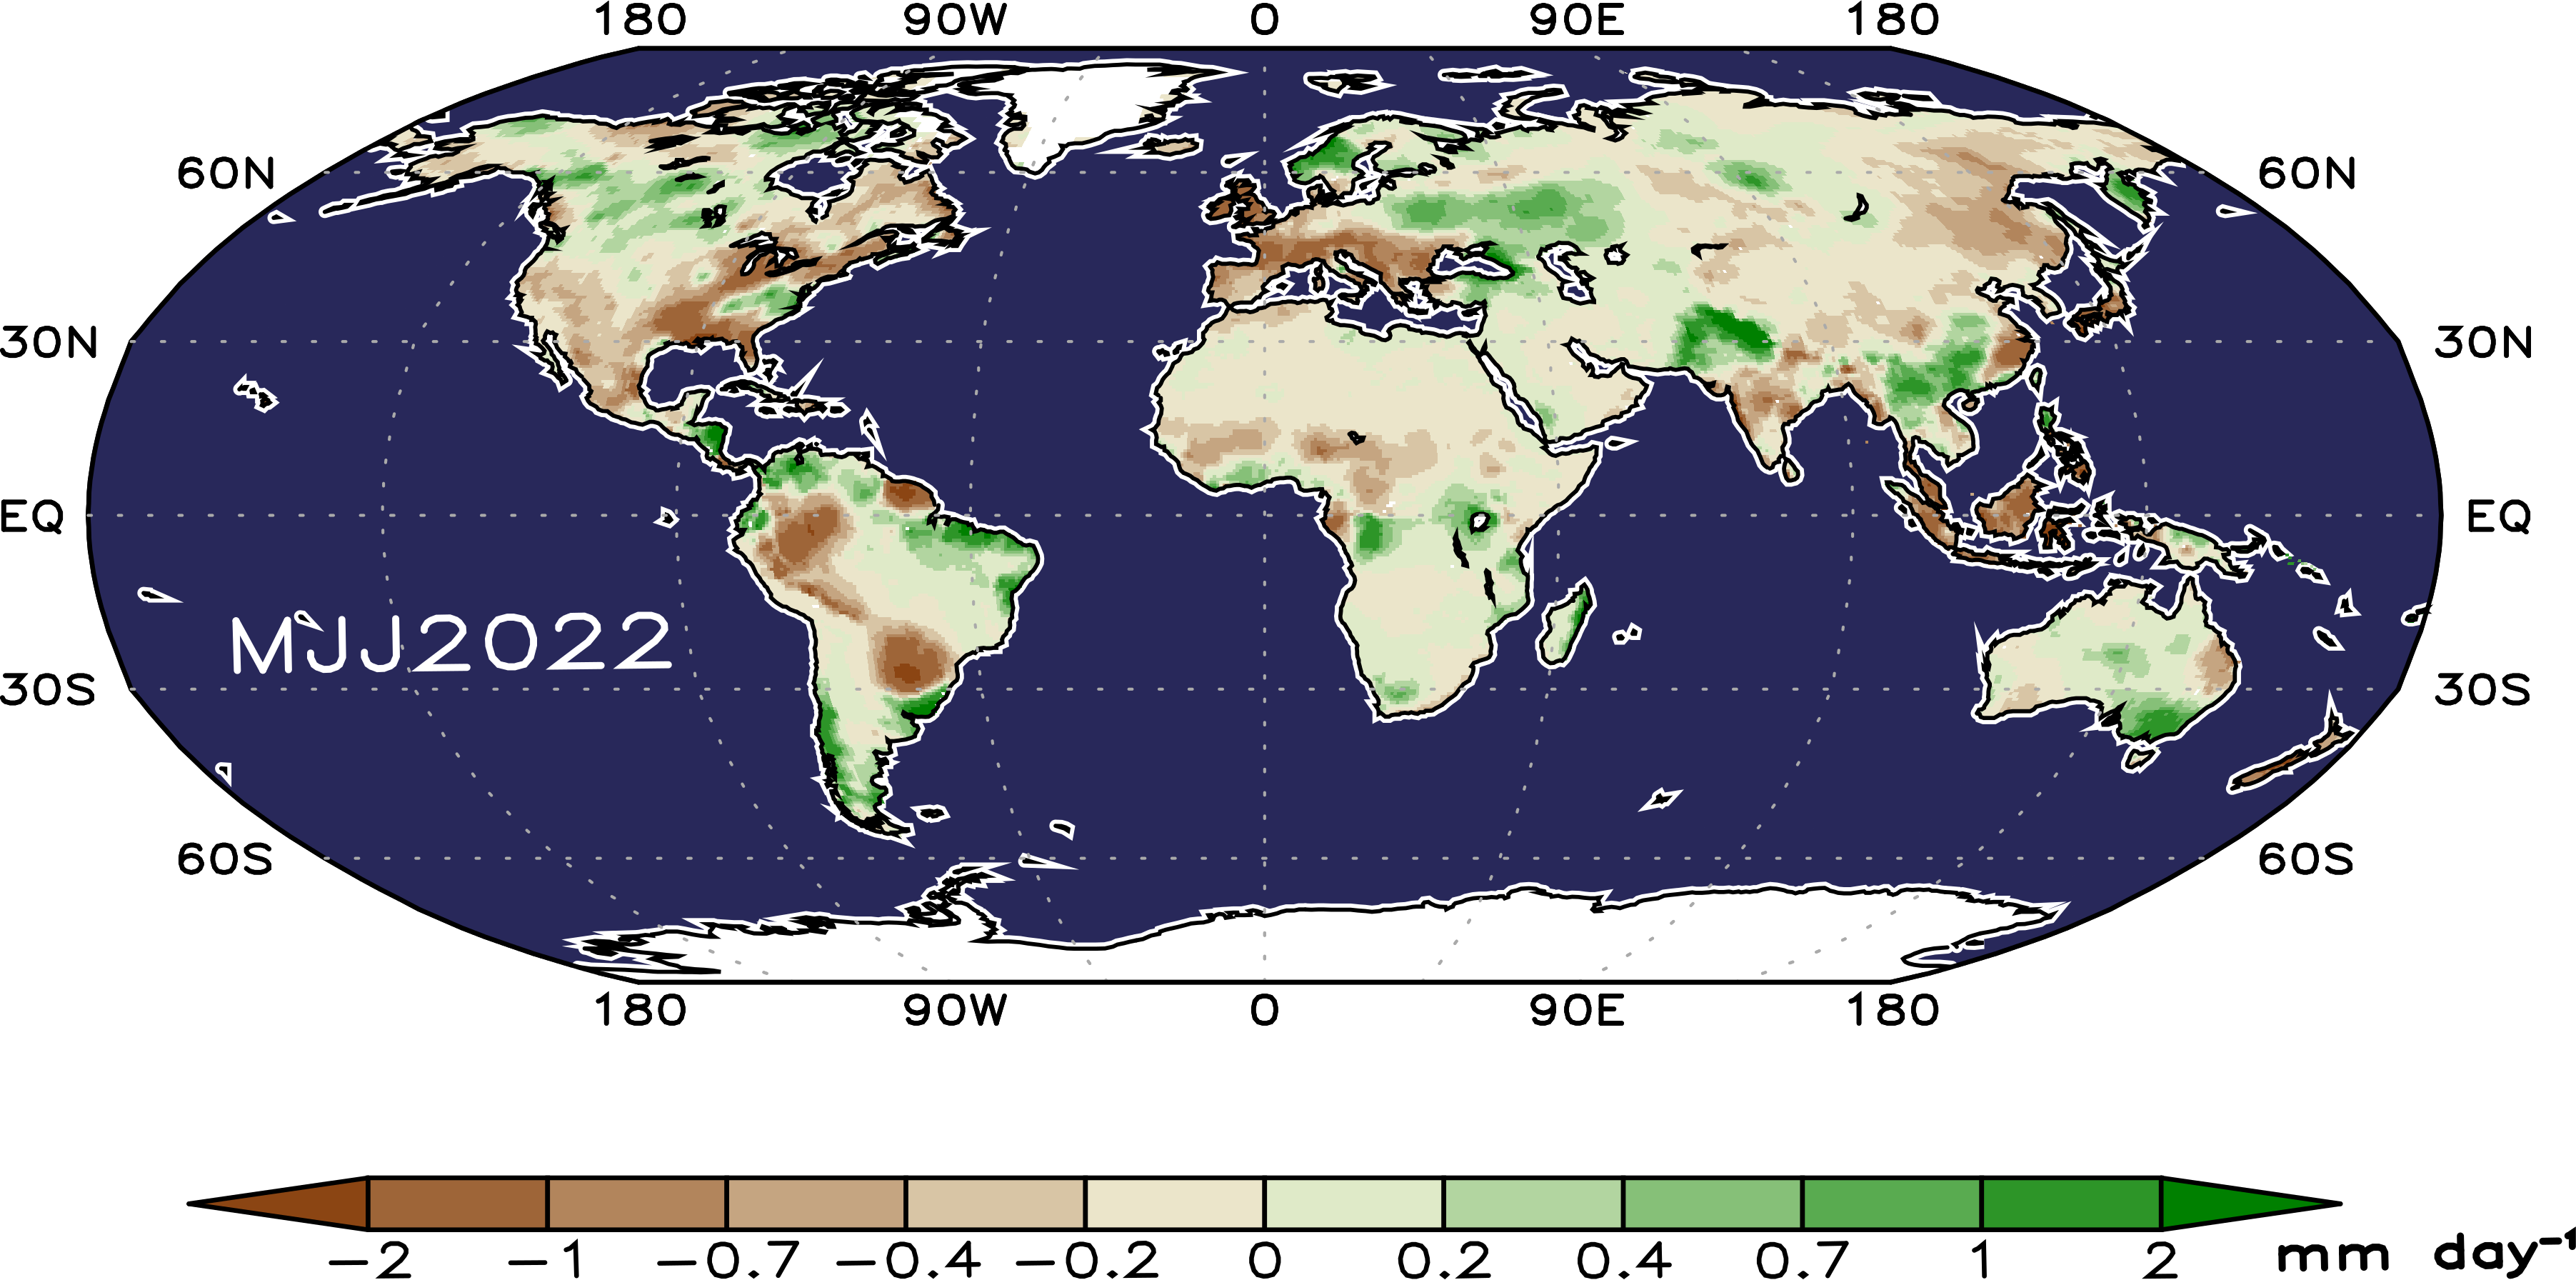 Precipitation anomaly-the latest three months and last four seasons. |
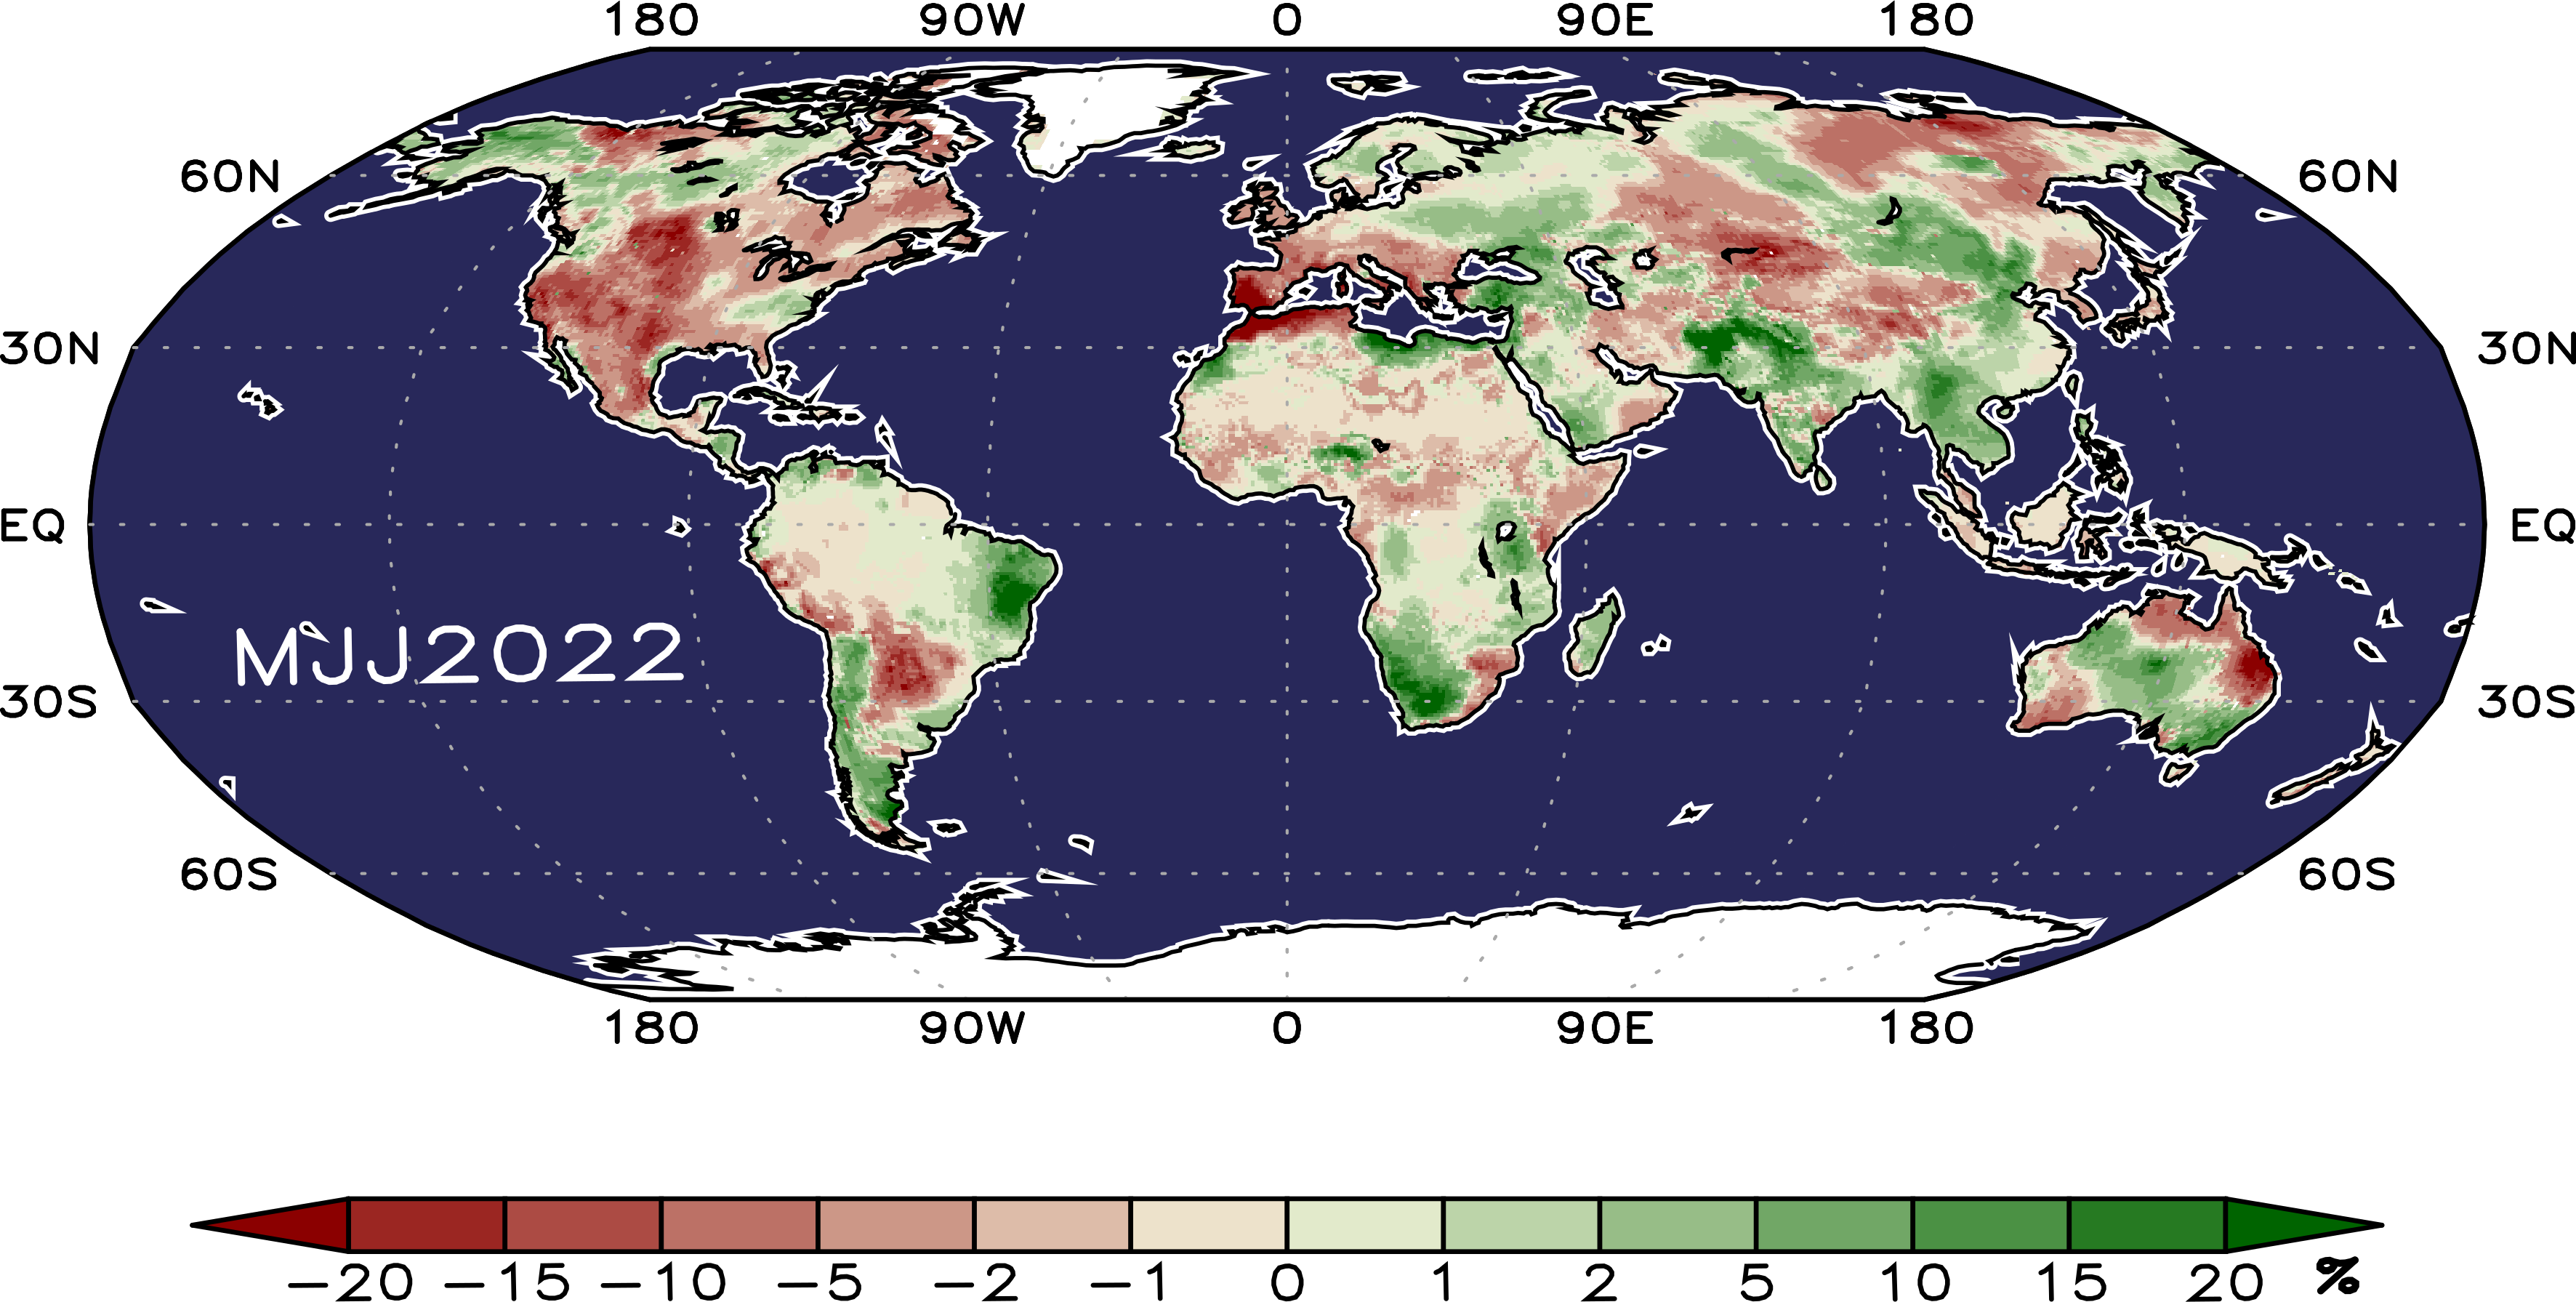 Soil wetness anomaly-the latest three months and last four seasons. |
Anomalies of global net land-atmosphere flux, NPP, soil wetness are modeled by VEGAS , driven by environmental drivers: precipitation (CRU, PRECL), surface air temperature (CRU, GISS), land use history (HYDE) and atmospheric CO2. All relative to 2010-2019 mean.
Contact: Ning Zeng, zeng@umd.edu
Contact: Ning Zeng, zeng@umd.edu