Research of Windfarm-Climate Interactions
Recent work (Keith et al., 2004) on the climate impact of very large scale wind farms has demonstrated appreciable effects on surface temperature, including warming and cooling on the order of a degree Celsius. Keith et al. (2004) simulated the impact of wind farms by increasing the roughness length (z0) in the boundary layer schemes of GFDL and NCAR CAM 2.0 general circulation models over large rectangular groups of grid points over North America, Europe and Asia. Models were run in fixed-SST mode. The increase in roughness led to circulation changes which in turn led to temperature changes. These temperature changes were not related in an obvious way to the imposed roughness length changes: for instance, temperature changes were not significantly larger over the simulated wind farms than over other regions. The figure below shows the temperature change at 2 m above the surface due to the increased roughness. The regions of increased surface roughness are outlined in black. Significance is indicated by stippling.

These results show a zonal pattern suggestive of a reduction in meridional heat transport. We speculated that a reduction in baroclinic growth rates due to enhanced surface friction might have reduced eddy heat transports and thus cooled regions poleward of the windfarms, and warmed regions equatorward of them. However, analysis of the model runs did not show any consistent response in eddy heat transport. Instead, we found that the patterns of warming and heating seemed most related to changes in wind direction, resulting in advective heating and cooling, and in changes in cloud fraction that influenced solar heating patterns. Our analysis was complicated by the boundary conditions of this model run, in which land surface temperatures were free to change, but sea surface temperatures were help fixed.
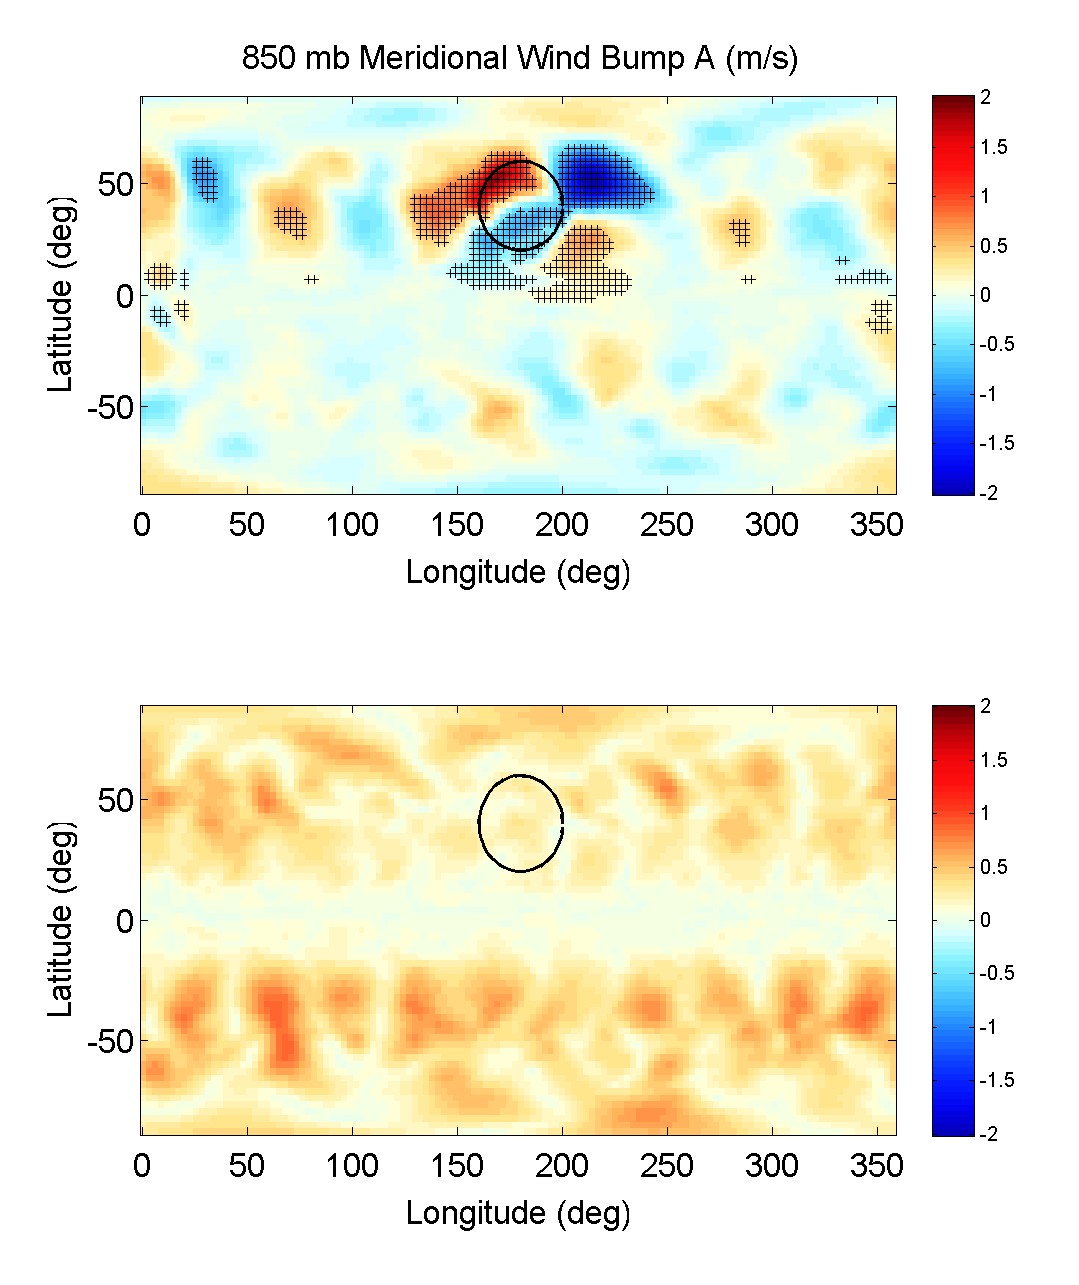
In order to clarify the physical mechanisms of wind-farm effects seen by Keith et al. (2004), we have run several experiments in a simplified setting. The NCAR Community Atmosphere Model version 3.0 was run in "Aquaplanet" mode, where all surface regions are set to be ocean with fixed sea surface temperature. In addition, instead of using the Charnock relationship to specify the surface roughness as a function of surface wind speed, the surface roughness was set to a fixed, uniform value of z0 = 0.009 mm. To simulate the wind-farm impact on climate, a circular region of enhanced surface roughness (z0 = 6.3 mm) was added. Several experiments, varying the location, size, and roughness of this region were performed. An example is shown below. The circle shows the region of enhanced roughness, and the stipling indicates significant results.

These experiments show a significant remote influence of large scale roughness changes on synoptic scale winds. My graduate student Dan Barrie and I are now exploring the influence of time-varying surface roughness on downstream storm tracks.
References
Keith, D.W., J.F. DeCarolis, D.C. Denkenberger, D.H. Lenschow, S.L. Malyshev, S. Pacala and P.J. Rasch (2004). The influence of large-scale wind-power on global climate. Proceedings of the National Academy of Sciences, 101, 16115-16120.
Kirk-Davidoff, D.B., and D.W. Keith, 2008: On the climate impact of surface roughness anomalies. J. Atmos. Sci, 65:2215-2234. DOI: 10.1175/2007JAS2509.1. Abstract
Barrie, D., D.B. Kirk-Davidof, 2009: Weather response to management
of a large wind turbine array.