| Name | Last modified | Size | |
|---|---|---|---|
| Parent Directory | - | ||
| Deon2007.png | 2015-09-17 17:15 | 0 | |
| imageManip.py | 2015-09-17 17:15 | 196 | |
| samplePyplot.py | 2015-09-17 17:15 | 207 | |
| fillPlot.py | 2015-09-17 17:15 | 224 | |
| polarBar.py | 2015-09-17 17:15 | 299 | |
| multipleLegends.py | 2015-09-17 17:15 | 339 | |
| annotatingText.py | 2015-09-17 17:15 | 351 | |
| simplePlot.py | 2015-09-17 17:15 | 367 | |
| multipleFiguresAxes_1.py | 2015-09-17 17:15 | 371 | |
| surface3d_demo.py | 2015-09-17 17:15 | 450 | |
| contourPlot.py | 2015-09-17 17:15 | 489 | |
| sampleHistogram.py | 2015-09-17 17:15 | 495 | |
| lineChart.py | 2015-09-17 17:15 | 513 | |
| spiralPlotting.py | 2015-09-17 17:15 | 561 | |
| pieChart.py | 2015-09-17 17:15 | 571 | |
| scatterChart.py | 2015-09-17 17:15 | 571 | |
| sampleColorbar.py | 2015-09-17 17:15 | 609 | |
| multipleFiguresAxes_2.py | 2015-09-17 17:15 | 659 | |
| areaChart.py | 2015-09-17 17:15 | 795 | |
| polarBarColor.py | 2015-09-17 17:15 | 799 | |
| logPlots.py | 2015-09-17 17:15 | 809 | |
| basemapSatellite.py | 2015-09-17 17:15 | 813 | |
| multiplePlots_fft1.py | 2015-09-17 17:15 | 921 | |
| barChart.py | 2015-09-17 17:15 | 1.0K | |
| basemapDataPlot_1.py | 2015-09-17 17:15 | 1.0K | |
| demoLegend.py | 2015-09-17 17:15 | 1.1K | |
| mapWorldPlot.py | 2015-09-17 17:15 | 1.2K | |
| basemapSample.py | 2015-09-17 17:15 | 1.2K | |
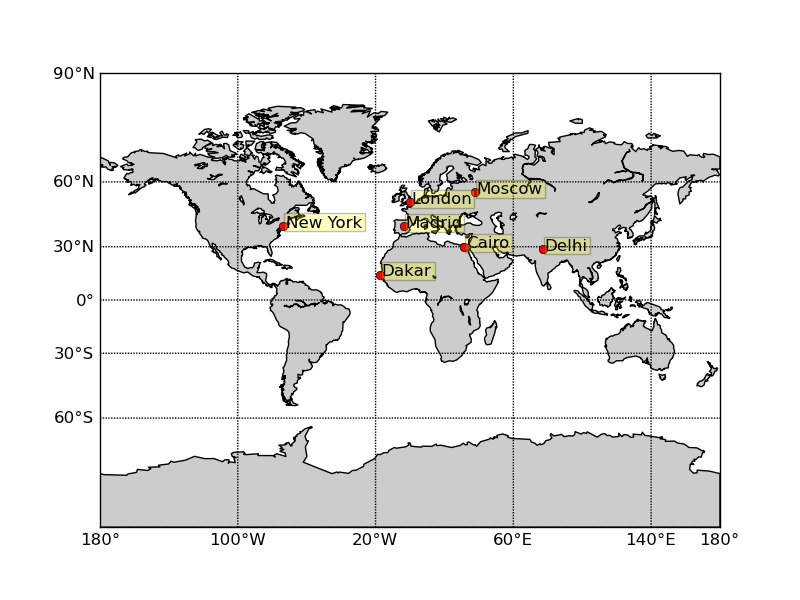
| mapCordinatesPlot.py | 2015-09-17 17:15 | 1.3K | |
| basemapDataPlot_2.py | 2015-09-17 17:15 | 1.5K | |
| basemapDataPlot_3.py | 2015-09-17 17:15 | 1.5K | |
| basemapDataPlot_flat.py | 2015-09-17 17:15 | 1.7K | |
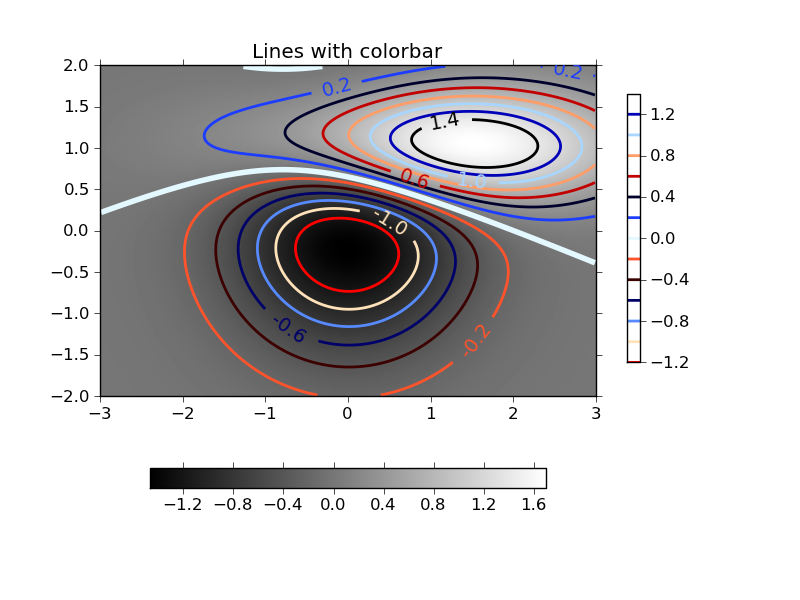
| testContours.py | 2015-09-17 17:15 | 1.8K | |
| demoContours.py | 2015-09-17 17:15 | 3.0K | |
| fig_citiesOverMap.png | 2015-09-17 17:15 | 123K | |
| fig_testContour.png | 2015-09-17 17:15 | 129K | |