Our research
focuses on quantification of the effect of human activity on atmospheric
composition, with a focus on
climate change, tropospheric chemistry, air quality, the carbon cycle, and stratospheric ozone
depletion and recovery. These efforts are motivated by the need to
quantify how atmospheric composition is being altered by emissions of
greenhouse gases and pollutants that drive global warming and degrade
the environment.
Climate
Change: Surface temperature responds
to a variety of natural and anthropogenic forcings including warming due
to rising levels of greenhouse gases (GHGs). We have developed a model
that tracks the influence on global temperature of GHGs, volcanic and
industrial aerosol particles, the 11 year variation in total solar
irradiance, the temporary heat exchange between the ocean and atmosphere
due to phenomena known as the El Niño Southern Oscillation (ENSO), the Atlantic Meridional Overturning Circulation, as well as long-term export of
atmospheric heat to the world’s oceans (Canty
et al., ACP, 2013).
Recently, we used this model to show that if all
of the pledges of the Paris Climate Agreement are followed, and if the
carbon intensity of the world’s economies can be improved such that at
least 50% of global energy can be obtained from renewables by year 2060,
climate catastrophe will likely be averted (Salawitch
et al., Springer Climate, 2017). The basis of the 50% renewables
by 2060 target is the finding that, for an empirical model trained
by data, the RCP 4.5 pathway for GHG emissions is the actual 2°C warming
pathway. This suggestion is consistent with our best understanding
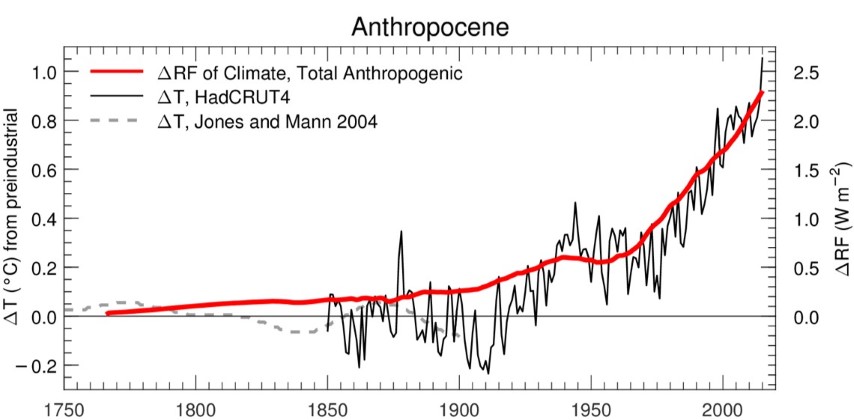
of historical variations in global warming and the radiative forcing (RF)
of climate, which reveal the association of ~1.0°C with about 2.25 Watts
per squared meter (W m-2)
of prior forcing:

Time series of global mean surface temperature
anomaly,
ΔT, and the RF of climate.
Simply put, 1.0°C warming is to 2.25 W m-2
RF of climate as 2.0°C warming is to 4.5 W m-2
RF. Our actual approach for projecting global warming
is much more sophisticated, taking into account uncertainties
in RF due to anthropogenic aerosols, climate feedback, and
ocean heat uptake. Nonetheless, the image above is
based on IPCC (2013) best estimates and provides support for
the notion that RCP 4.5 is the true 2°C warming pathway,
since RCP 4.5 implies 4.5 W m-2 RF of climate by end century. Can learn more
about our group's work on climate at
this link.
We are now assessing the impact on
global warming forecasts of the recent U.S. withdrawal from the Paris
Climate Agreement
agreement, integrating emissions from the
Shared Socioeconomic Pathways (SSP) database into our model
framework, and converting material from Chapters 2, 3, and 4 of our book
into journal articles. The journal article presentation of our
global warming projections will include a more realistic depiction of
ocean heat uptake than was used in the book. While some of the details
will change, the overall message is the same: adherence to RCP 4.5 GHG
emissions would place the world on a 2°C warming pathway.
_____
Tropospheric Chemistry:
Hydroxyl radical (OH) is the primary oxidant in Earth's atmosphere and
determines the lifetime with respect to removal of many pollutants, such
as the methane (CH4),
a potent greenhouse gas. Our past research has focused on improving our
knowledge of two quantitative aspects of the abundance of OH in Earth's troposphere:
1)
the
level of OH implied by detailed observations of O3,
H2O,
NO, and other species in the Tropical Western Pacific (TWP) during
the CONTRAST campaign (Nicely
et al., JGR, 2016)
2)
the
reason why levels of OH found by various global models of
atmospheric chemistry differ by such a large extent (Nicely
et al., JGR, 2017)
The first
study revealed that the concentration of OH in the middle and upper
troposphere of the TWP, illustrated below, is likely larger than previously
assumed due to prior underestimates of O3
(see also
Newton et al., ACP, 2016) and nitrogen monoxide (NO)
(see also
Anderson et al., Nat. Comm., 2016) as well as a source
of OH supplied by oceanic release of of acetaldehyde (CH3CHO)
that others had not considered. As such, gases such as CH2Br2
will be oxidized in the mid-troposphere: compounds such as CH2Br2
can reach the stratosphere, but only if lofted from the marine boundary
layer to the upper troposphere by energetic convection that bypasses
middle troposphere.
The second
study utilitized a neural network to simulate the chemistry within 8
global models based on an analysis of archived output. The goals
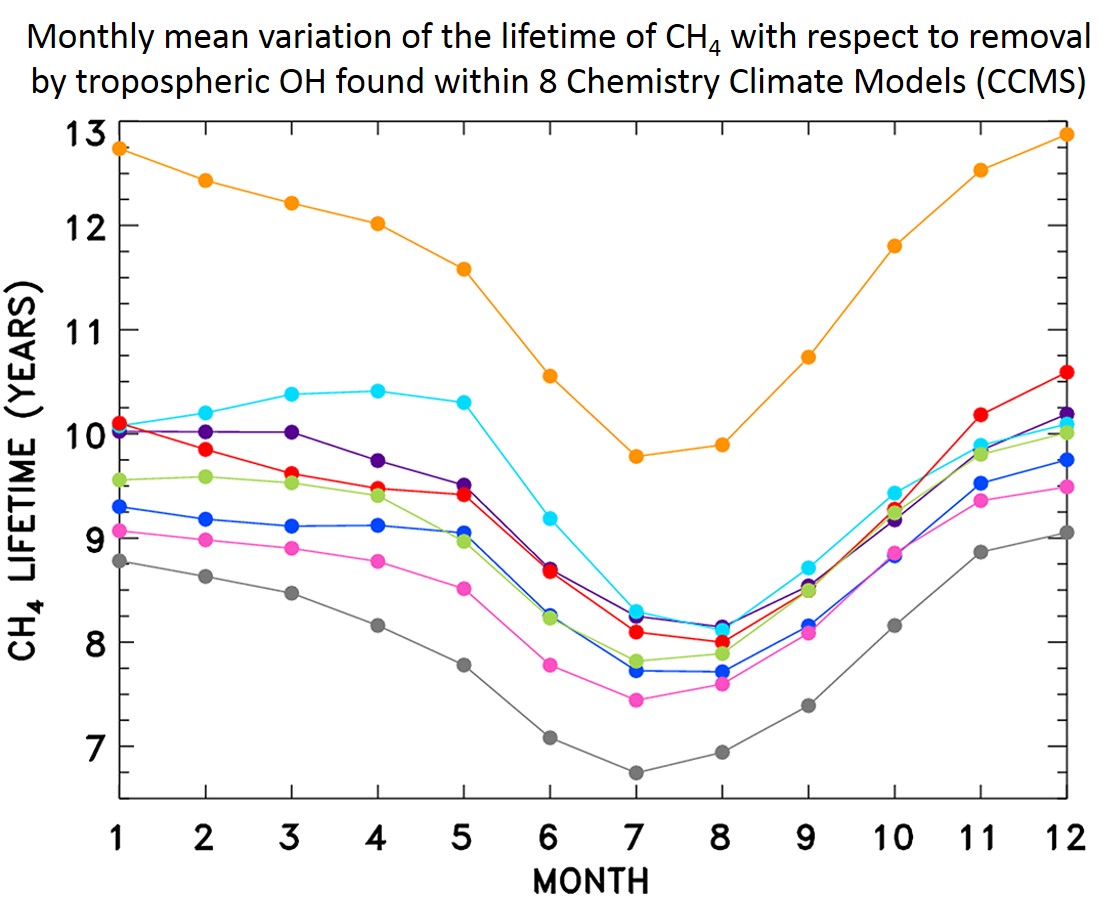
of this study were to quantify why the lifetime of methane (CH4)
for removal by reaction with tropospheric OH differs so much between the
models (see below) as well as with a value for the lifetime of CH4
inferred from the decay of CH3CCl3.

We concluded
that the largest differences for the tropospheric abundance of OH
between these models were, in order of importance: a) chemical mechanism; b) the photolysis frequency of
O3 leading
to the production of vibrationally excited oxygen [O(1D)];
c) the abundance of O3;
d) the abundance of carbon monoxide (CO).
We are now
focusing efforts in this area of research to analysis of data collected during the
NASA ATom mission
as well as archived results from global model output provided by groups
that participate in the
Climate-Chemistry Model Initiative. Our efforts are conducted
in close collaboration with
Dr. Julie
Nicely of NASA Goddard, who laid the ground-work for our work in
this area. The overall goal of these endeavors is to provide
better theoretical underpinnings for representation of the loss of CH4
by reaction with OH in global models.
_____
Air
Quality.
Elevated levels of tropospheric ozone cause respiratory problems
linked to increased morbidity and mortality in humans as well as
significant damage to crops and plants. High levels of surface ozone
are caused by nitrogen oxides and hydrocarbons released in the
exhaust of power plants, factories, and vehicles. Our research
effort is focused on the analysis of NASA satellite and aircraft
observations of atmospheric composition, using regional air quality
models such as CMAQ and CAMx as well as data collected by aircraft
deployed as part of the UMD Regional Measurement, Modeling and
Prediction Program (RAMMPP), to provide the scientific basis for
policy decisions focused on achieving stringent, future air quality
standards.
We recently
have shown that elevated ozone on hot summer days
in the mid-Atlantic is caused, in part, by pollution from power
station peaking units utilized to meet unusually high demand for
electricity during the warmest days of summer (He
et al., GRL, 2013). We
have also shown,
based on analysis of data collected during the
DISCOVER-AQ field
campaign, that the emission of nitrogen oxides from automobiles
within inventories used by EPA air quality models is likely high, by nearly a
factor of two, compared to the actual emissions (Anderson
et al., Atmos. Envir., 2014).
Canty et al. (ACP, 2015) showed observations of the
rural to urban ratio of tropospheric column NO2
observed by the NASA OMI instrument are simulated more accurately upon
use of the factor of 2 reduction in mobile NOx emissions as well as
faster deposition of a class of compounds known as alkyl nitrates.
Finally, we assessed the
implications
of all of the above work for future regulatory actions needs to attain
the National Ambient Air Quality Standard (NAAQS) for surface O3
in the mid-Atlantic: simply put, more benefit will likely result from
power plant emission reductions than commonly thought (Goldberg
et al., GRL, 2016).

NASA P3 aircraft
during DISCOVER-AQ as seen from the UMD RAMMPP aircraft.
Our
current air quality research efforts are focused on:
1)
continuing to improve the representation of the photochemical
mechanism within air quality models, including a suggestion for a
modification of the HCHO to C5H8
ratio within the CB6r2 mechanism we termed CB6r2-UMD (Marvin
et al., Atmos. Envir., 2017)
2)
improving the representation of the emission of pollutants by marine
vessels within air quality models (Ring et al., submitted, 2017)
3)
conducting a retrospective analysis of surface measurements from
various air quality sites since the early 1970s, as well as
satellite measurements of column NO2
and HCHO available for the past several decades, to assess the
relative contributions of emission reductions of NOx, VOCs, and CO
on improvements in air quality (Roberts et al., manuscript in
preparation)
4)
Supporting the Maryland Department of the Environment (MDE) in
their preparation of documents that must be submitted to the U.S. Environmental Protection
Agency in order for Maryland to achieve the NAAQS for surface O3
The group's
efforts on air quality have a strong bearing on policy, as manifest by
my service on the MDE
Air Quality Control Advisory Council.
_____
Carbon Cycle.
Carbon
dioxide (CO2)
is the most important anthropogenic GHG and, quite literally, the
single greatest waste product of modern society. About half of the
CO2
released by human activity is taken up by the world’s oceans and
terrestrial biosphere. The precise location and magnitude of these
carbon sinks is unknown, yet of enormous importance for defining
interactions within the global carbon cycle that might be altered by
climate change. Quantification of these carbon sinks is vital for future management
of the global carbon cycle. We are part of the
NASA Orbiting Carbon Observatory
(OCO-2) science team. OCO-2 launched on 2 July 2014, ascended to it's lead spot on the
NASA A-train in early August 2014, and is now producing
observations of atmospheric CO2
that are improving our understanding of the global carbon
cycle.
Recently, the United States has become heavily dependent on the
generation of energy from the combustion of natural gas (NG), which is
primarily composed of methane (CH4),
due to abundant domestic reserves of NG being extracted by hydraulic
fracturing (i.e., fracking). Ostensibly, the combustion NG is
better for Earth's climate than the combustion of coal, because about
twice as much energy per CO2
molecule released to the atmosphere is provided by NG compared to
coal. However, since CH4
is a more potent greenhouse gas than CO2,
leakage of just a small amount of CH4
to the atmosphere, anywhere from extraction to combustion, tips the
scales such that use of NG becomes harmful to climate compared to coal.
The leakage rates that cause use of NG to balance use of coal are 2.3%
if one considers climate effects over a 20 yr time horizon and 6.9% over
a 100 yr horizon (see footnote 35 of
this reference for derivation of these break even points).
We are
presently studying two aspects of the carbon cycle. One area of
research involves attempting to understand how the efficiency of carbon
uptake by the combined ocean / terrestrial biosphere is changing over
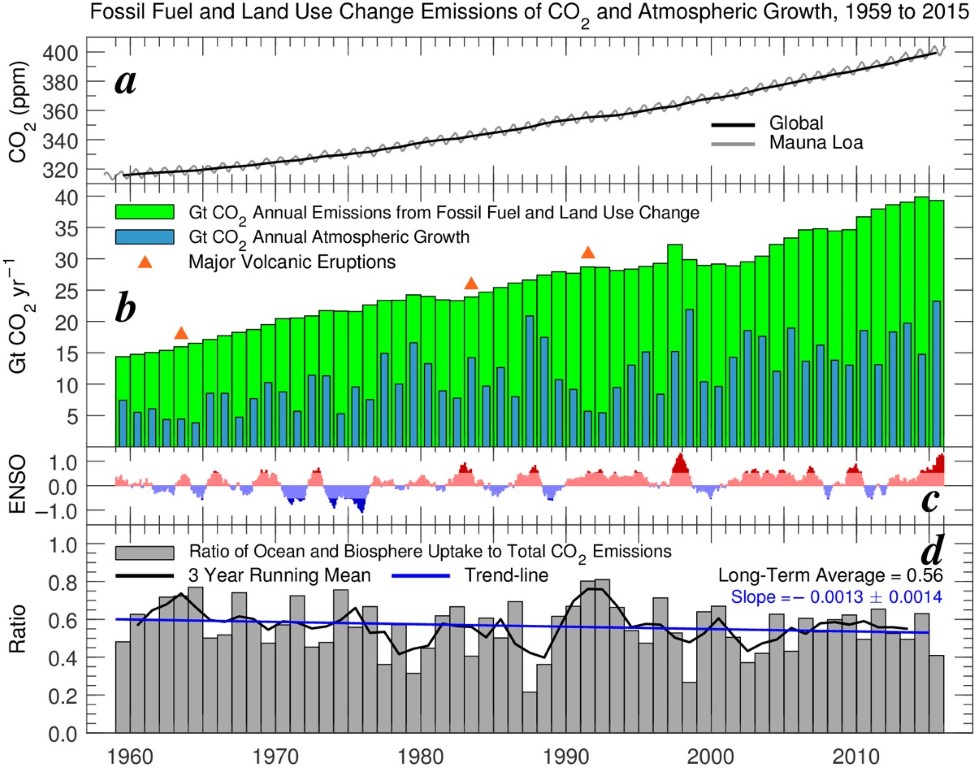
time. The figure below shows a time series of atmospheric CO2
(top), emissions of CO2
(middle green) and growth of atmospheric CO2
(middle blue), together with the Ratio of the height of the blue bars
(atmospheric growth) to the height of the green bars (total emissions).
The Ratio, shown in grey on the lower chart, suggests the efficiency of
carbon uptake by the combined ocean / terrestrial biosphere sink could
be declining over time. Can learn more about the figure shown
below at this
link.

However, it
is important to realize that the latter years have been influenced by a
strong ENSO event.
The second
area of carbon cycle research involve analysis of aircraft observations
of CO2
and CH4
obtained in the Baltimore Washington region by an aircraft campaign called
Fluxes of Atmospheric Greenhouse Gases in Maryland (FLAGG-MD)
sponsored by the
GHG measurement program of the U.S. National Institute of Standards and
Technology. FLAGG-MD began obtaining aircraft observations
in winter 2015 and is modeled
after the highly successful
INFLUX experiment.
Recently, we published a paper that revealed the occurrence of
significant emissions of CH4
from the Marcellus Shale region of southwestern Pennsylvania, and area
of active fracking operations (Ren
et al., JGR, 2017). The FLAGG-MD observations
analyzed by Ren et al. showed a leakage rate of about 3.9%of the total
oil and natural gas production mass in this region, which means that the
extraction of CH4
by fracking is harmful to Earth's climate, over a 20 year time
horizon for conditions encountered during August and September 2015.
Our
current carbon cycle research efforts are focused on:
1) quantification
of how the efficiency of the removal of CO2 by the
combined
ocean /
terrestrial biosphere sink is changing over time
2)
assessing how aircraft measurements of CO2
and CH4
obtained during FLAGG-MD can be used to improve our knowledge of
fluxes of these two GHGs over the densely population Baltimore
Washington urban region, using a mass balance approach tied to air
parcel trajectories (see
Ren et al., JGR, 2017 for a
description of the technique) (Ahn et al., manuscript in
preparation)
3)
quantification of CH4
fluxes over the Marcellus Shale region based on aircraft flights
conducted in 2017
4)
comparing profiles of CO2
obtained during FLAGG-MD to retrievals of the dry air, column
average mole fraction of CO2
(XCO2)
retrieved by the OCO-2 team
5)
assessing whether the mass balance approach for quantifying fluxes
of CO2
can be applied to observations of XCO2
obtained by OCO-2
_____
Stratosheric Ozone Depletion and Recovery.
The Earth's ozone layer protects humans, plants, and animals from the
harmful effects of ultraviolet radiation emitted by the Sun. Ozone
depletion has resulted from the industrial release of a class of
compounds called ozone depleting substances (ODSs) that contain chlorine
and/or bromine. An excellent, readily accessible summary of the
successful regulation of ODSs is provided by
this document that I am proud to state I have helped write over the
years, together with many colleagues. I also recently published an
succinct essay on Chlorinated Fluorocarbons and Other
Ozone-Destroying Chemicals that can be obtained by
clicking here.
Our
efforts on stratospheric ozone and recovery are focused on quantifying
the role of very short-lived (VSL) naturally produced biogenic
bromocarbons on the stratospheric bromine loading (Salawitch,
Nature, 2006). Here, VSL refers to an atmospheric compound with a
photochemical lifetime
with respect to removal of less than 6 months. The supply of of
stratospheric bromine from VSL sources has been difficult to quantify
because:
a) the
souce gases have an atmospheric abundance that is quite variable in
space and time
b)
significant injection could occur via cross-tropopause transport of
inorganic gases (so-called products) produced upon tropospheric
decomposition of source species.
Nonetheless,
it has been established that if significant amounts of bromine enter the
stratospheric from this natural source, the ozone layer is more
vulnerable to depletion following volcanic eruptions (Salawitch
et al., GRL, 2005) and also if society ever decided to
attempt to mitigate global warming via the injection of sulfate
aerosols to the stratosphere (Tilmes
et al., Science, 2008;
Tilmes et al., ACP, 2012). The abundance of VSL
bromine has also been shown to have a significant effect on the depth
and perhaps timing of the recovery of the Antarctic ozone hole (Oman
et al., GRL, 2016;
Fernandez et al., ACP, 2017). Finally, the inference
of tropospheric column BrO from a measurement of the total column BrO
obtained by satellite instruments is extremely sensitive to the
stratospheric burden of bromine supplied by VSL compounds (Salawitch
et al., GRL, 2010).
The CONTRAST
(Pan
et al., BAMS, 2017), ATTREX (Jensen
et al., BAMS, 2017) and CAST (Harris
et al., BAMS, 2017) aircraft campaigns conducted
during the winter of 2014 in Guam were designed, in part, to provide
observations that would allow the stratospheric supply of bromine from
VSL compounds to be precisely quantified. This joint effort
represents the first comprehensive sampling of VSL bromocarbons,
together with BrO, from altitudes ranging from the marine boundary layer
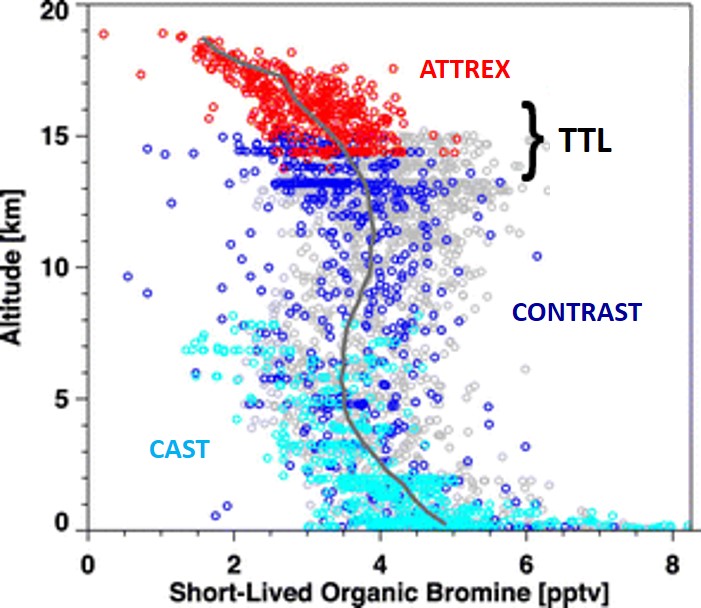
to the lower stratosphere. The measurements revealed the presence
of about 3 parts per trillion (pptv) (bromine content) of organic VSL
compounds in the tropical tropopause transition layer, as shown below.

As noted
above, the quantification of stratospheric supply of bromine from VSL
compounds requires quantification of both organic (source gases) and
inorganic (product gases). The NCAR GV aircraft used for CONTRAST
contained two instruments that measured BrO, from which the total
inorganic bromine burden can be found. One instrument relies on chemical
ionization mass spectrometry (CIMS) via in situ sampling (Chen
et al., JGR, 2016). The other instrument
utilizes remote sensing via Differential Optical Absorption Spectrometry
(DOAS) (Koenig
et al., ACPD, 2017). Chen et al. (2016) reported
product gas injection of Bry to be about 2 pptv which would lead to a
total VSL bromine source of about 5 ppt. Koenig et al. (2017)
focused mainly on profiles of BrO in the tropical troposphere, arguing
for the presences of a significant source from sea salt aerosol.
Our
current stratospheric ozone depletion and recovery research efforts are focused on:
1) quantification
of stratospheric injection of bromine from VSL sources by combining
observations of organic compounds with the CIMS and DOAS
observations of BrO, in a common analysis framework (Wales et al.,
manuscript in preparation)
2)
assessing the impact of future volcanic eruptions on the thickness
of the ozone layer by considering, within the AER-2D model, various
scenarios for the future evolution of GHGs as well as stratospheric
halogen burdens (Klobas
et al., GRL, 2017)
3)
evaluation of various possible sources of the springtime, annual
release of bromine to the Arctic troposphere (the so-called bromine
explosion) (Choi et al., JGR, submitted, 2017)
4)
reconciliation of the CONTRAST/ATTREX estimate of VSL bromine with
total column BrO measured by the NASA OMI instrument, taking into
consideration correlative ground-based observations of total column
BrO by a suite of instruments deployed in Fairbanks, Alaska (Wales
and Spinei, research in progress)


