(this page is still very much under construction.)
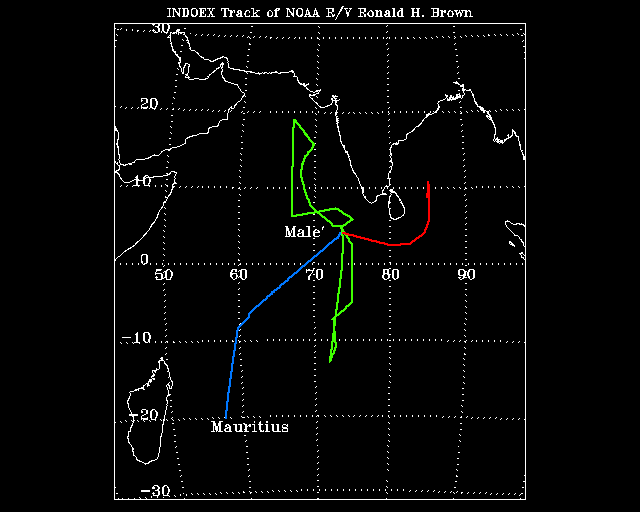
This is where we went:

The blue leg is the first one, then we did the green leg, and finally finished with the red one. We did the northern half of the green one first, by the way.
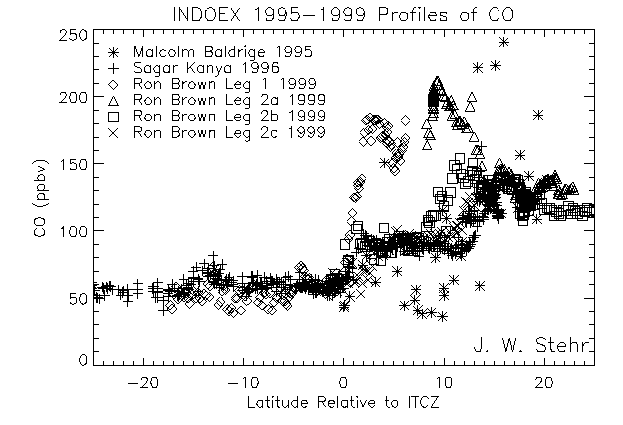
Here's a look at how CO has varied with latitude and year. Note how the variability is much larger in the Northern Hemisphere, where the ship was much closer to continental sources of pollution. Also, even where the ship was far removed from sources of pollution, the polluted Northern Hemisphere's background level of CO is considerably higher than that for the Southern Hemisphere.

click
here to download (you'll probably view it first) the gif file.
click
here to download the postscript file.