A uniqueness of the research is the study of
land-atmosphere interaction embeded in the
broader context of atmosphere-land-ocean interaction, as related to
natural climate variability such as the El Nino/Southern Oscillation,
as well as impact of anthropogenic effects such as tropical deforestation.
One approach is to simplify the many processes in the atmosphere and
the land-surface based on observations or theoretical/modeling results,
so the interactions among the subsystems can be delineated.
Our current workhorse tools include the
Simple-Land (SLand)
land-surface parameterization scheme and the
Quasi-equilibrium Tropical Circulation Model (QTCM).
-
Local feedbacks as well as the
large-scale responses in the atmosphere and ocean to the Amazon deforestation
are studied through numerical modeling using models of intermediate complexity.
|
|
-
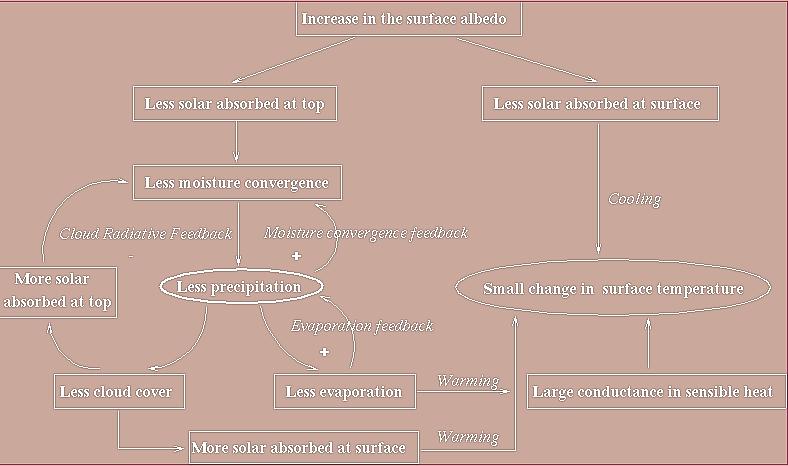
A land-atmosphere interaction theory is developed
for the tropical deforestation problem.
The theory emphasizes the
energy and water balance. It highlights the interaction among processes of
moist convection, cloud, radiation and surface hydrology
while each individual process is simplified.
The zero surface energy flux condition, due to the small
heat capacity of land, makes land-atmosphere interaction
distinctly different from ocean-atmosphere interaction.
This imposes a constraint on the sensitivity to the details
of surface energy partitioning.
Consequently, land surface temperature is largely a response to the
energy and water balance, rather than a forcing as in the case of
sea surface temperature.
The figure depicts the feedback loops in the local energy and water budget.
|

|
-
Observational data are analyzied, providing inspiration and checks for the
theoretical and modeling work. The figure shows the Amazon basin hydrologic
cycle based on observed rainfall, historical river discharge data and
atmospheric reanalysis.
|
|
-
Individual processes are further scrutinized. Knowledge gained helps
to develope better parameterizations for numerical models, which
in turn help the modeling effort in predicting/understanding future
climate change.
The figure shows the results of a proposed parameterization of the
reevaporation of the water lost through interception, taking into account
of the spatial and temporal variability of rainfall, compared to the observation
from the ARME experiment conducted near Manaus, Amazonia.
|
|