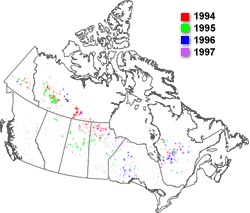
| Burnt area mapping
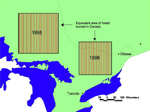
It combines individual daily fire masks to give an overview of the detected forestb fires across Canada throughout the entire burning season for the four years (1994-1997). Data from 1995 yearly fire mask were compared to data obtained by two Canadian fire detection agencies.
|
|
| Fraser
et al. (2000a) developed a technique for annual burnt area mapping of boreal forest.
The method, dubbed HANDS (Hotspot and NDVI Differencing Synergy), combines multi-temporal
change detection with active fire monitoring. In conventional spectral change
detection approaches (e.g. image differencing) a significant challenge is to establish a
threshold suitable for identifying those pixels that have undergone change. Change
detection techniques also are susceptible to producing spurious changes due to factors
other than real land cover change, such as cloud contamination, image misregistration, and
phenological variation. HANDS is designed to minimize these problems by using an annual
mask of satellite-detected fire locations to derive spatially variable thresholds for
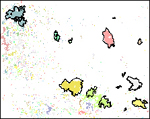
separating burnt pixels. Since the resulting burn clusters are required to be
spatially coincident with the fire mask, change pixels not associated with burning are
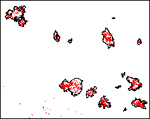
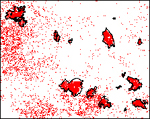
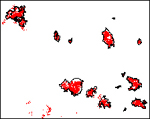
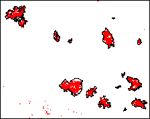
largely eliminated. The processing steps required by the procedure is shown in figure 1 and described briefly below. More detailed information is presented in Fraser et al. (2000). An annual composite of AVHRR hotspots (Fig. 1b) is used to derive
regional-level (200x200km) difference thresholds from a pair of anniversary date, VI
composites The above procedure for burnt area mapping requires three types of input data: 1) pre- and post-fire composite images used for multi-temporal differencing; 2) an annual hotspot mask; and 3) a vegetation mask or land cover classification. A previous application of HANDS for mapping forest fire burns in 1995 and 1996 relied on NOAA/AVHRR for all three inputs (Fraser et al. 2000a). Hotspots were composited from single date masks produced using a boreal fire detection algorithm (Li et al. 2000). Anniversary date 10-day NDVI composites from the end of successive fire seasons were used for differencing, while an AVHRR land cover classification was used to mask non-forest cover. |
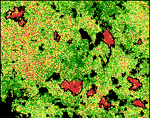 Fig1. NDVI Differencing
Fig 2. Conform Hotspots
Fig 3. Apply Reginal Threshold
Fig 4. Filter & Connect Burn Clusters
Fig 3. Apply Local Threshold
Fig 4. Eliminate False Burns
Fig 5
Fig 6
|