Climate Division 6 (North Central), Maryland
1895-2023
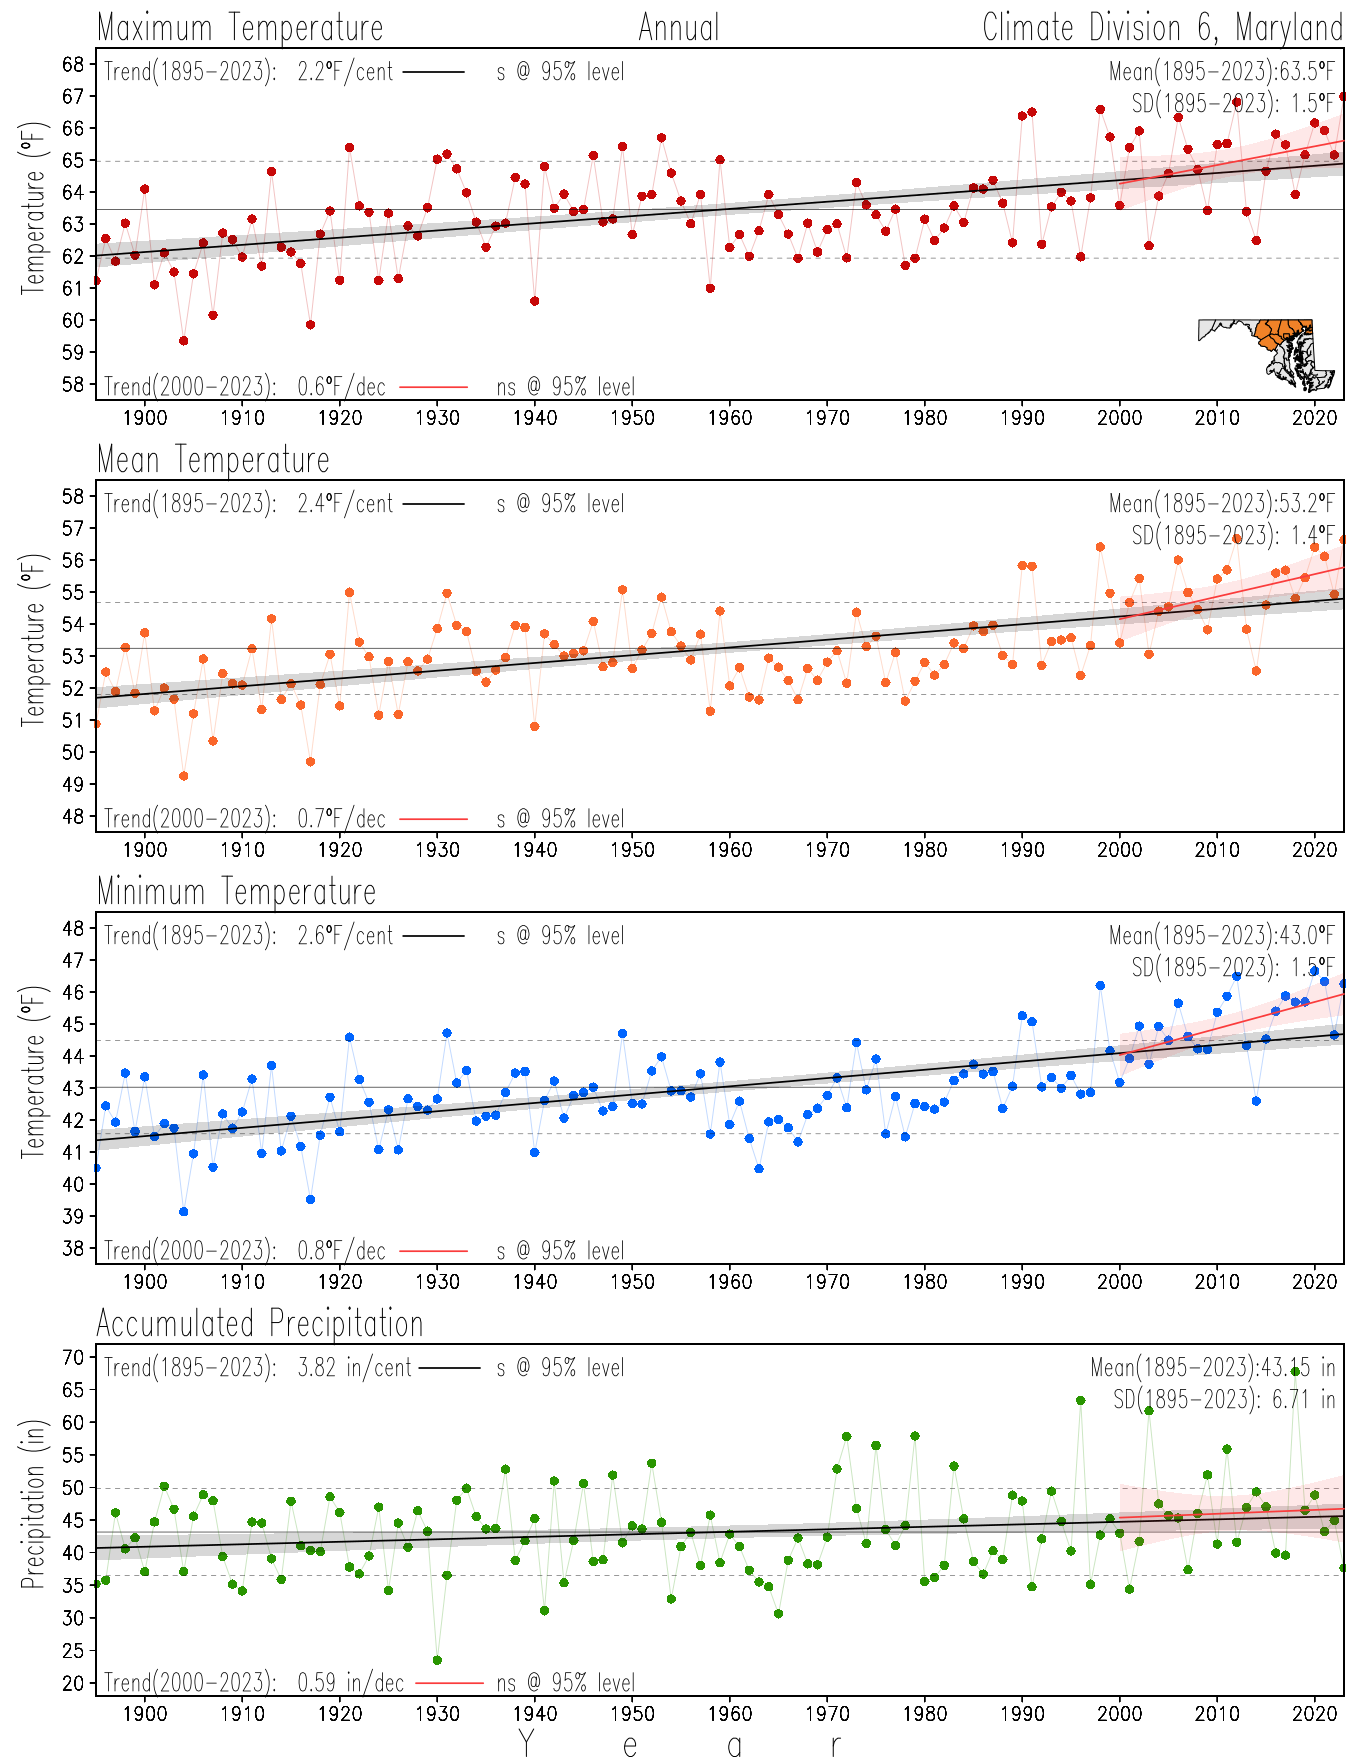
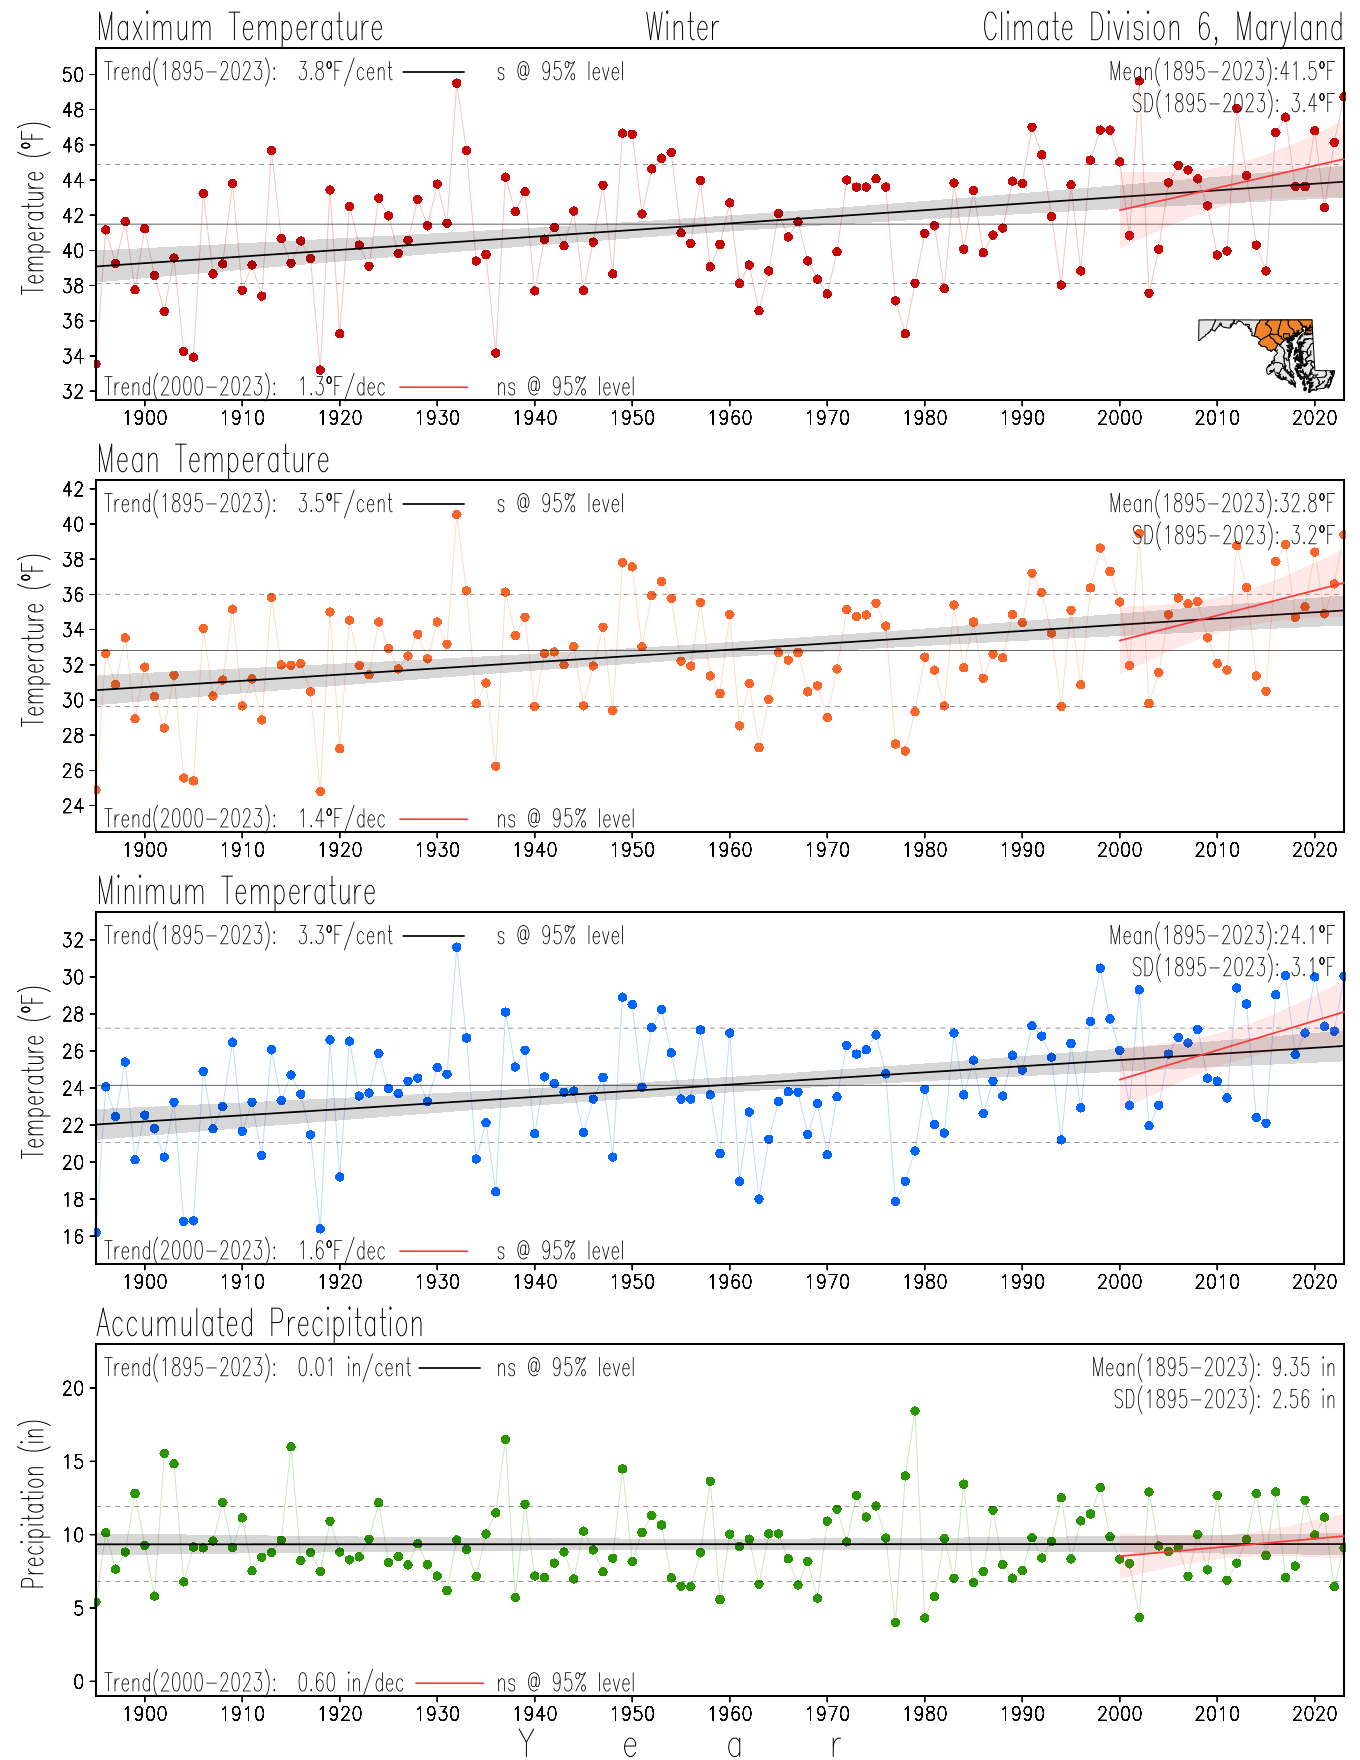
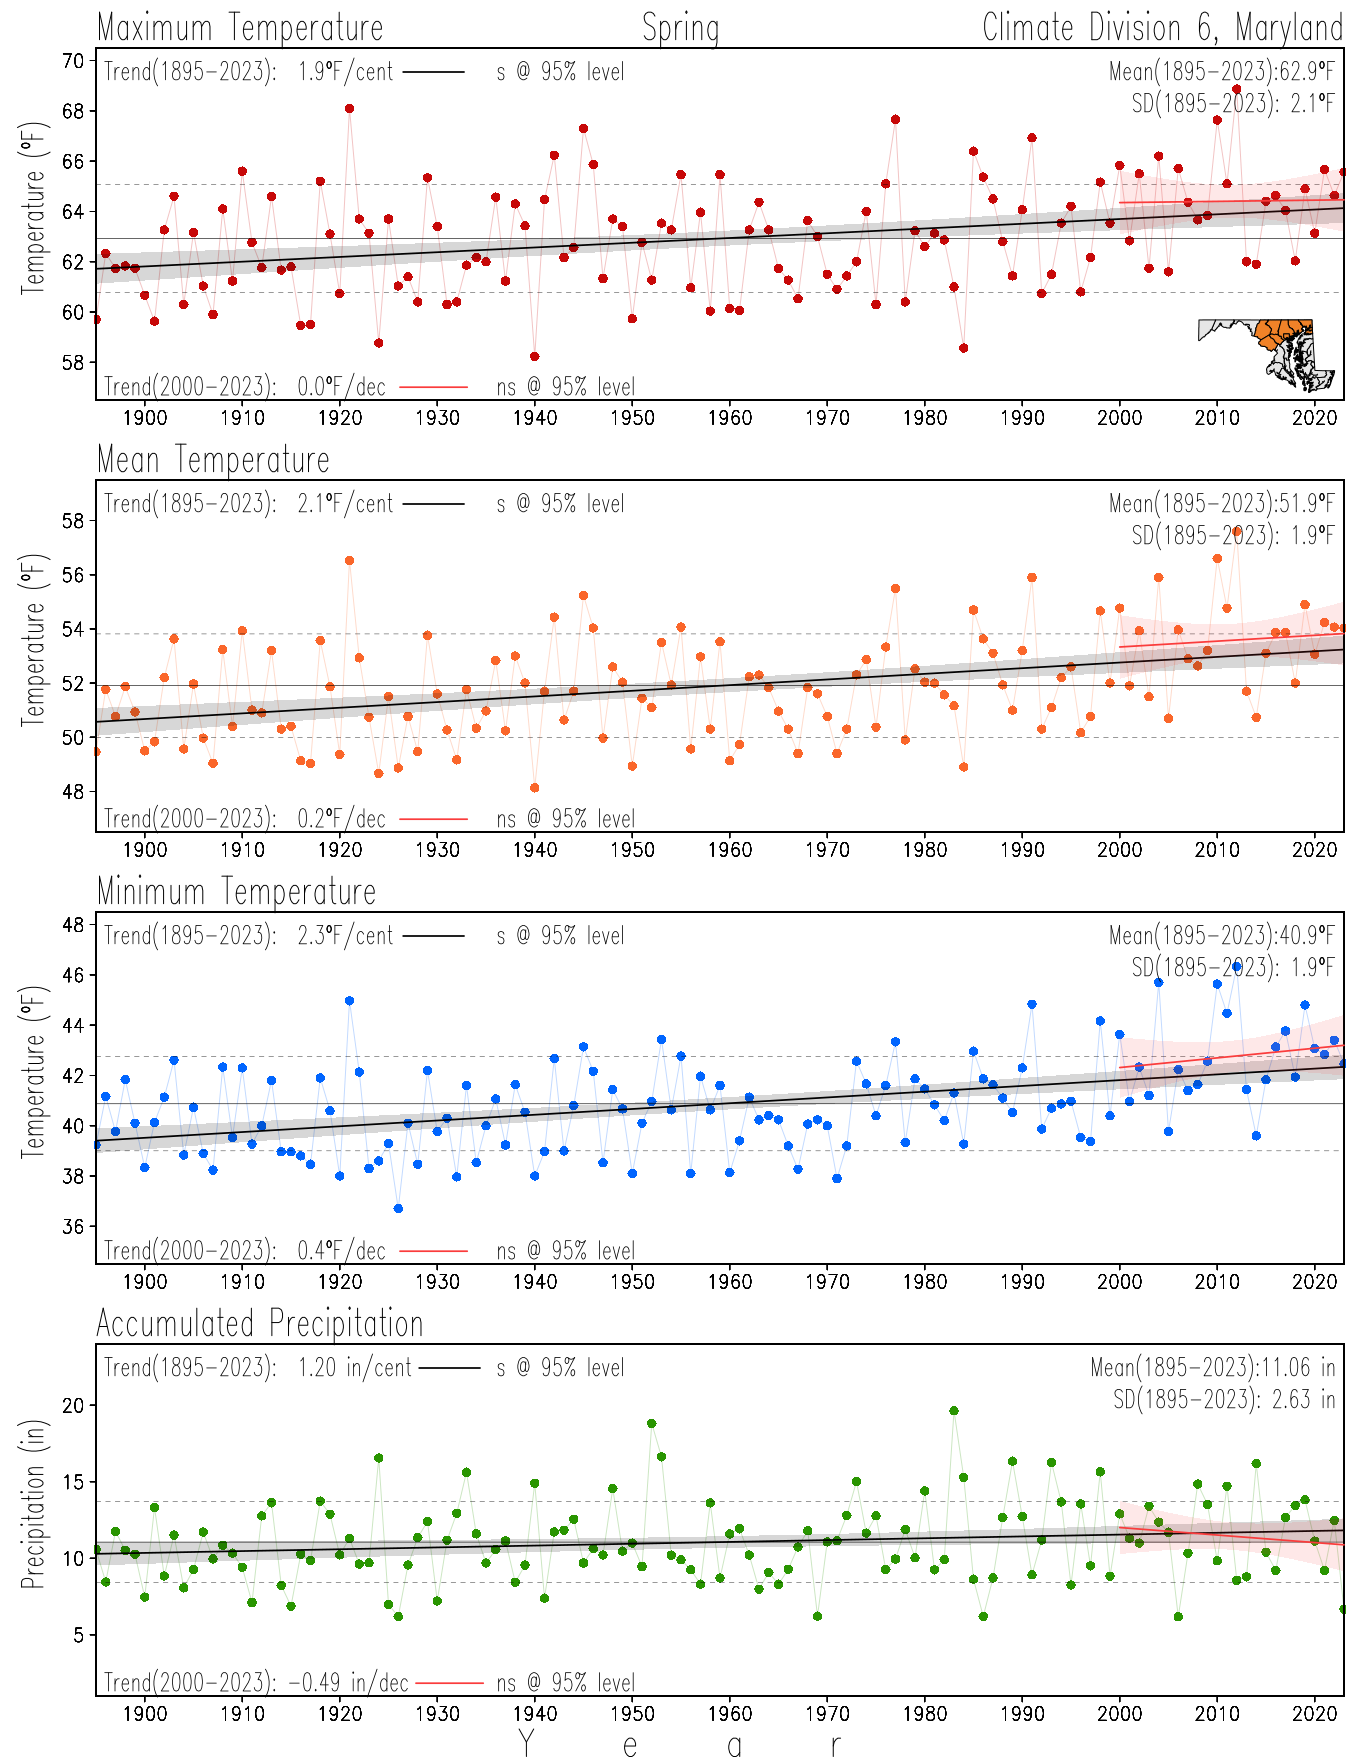
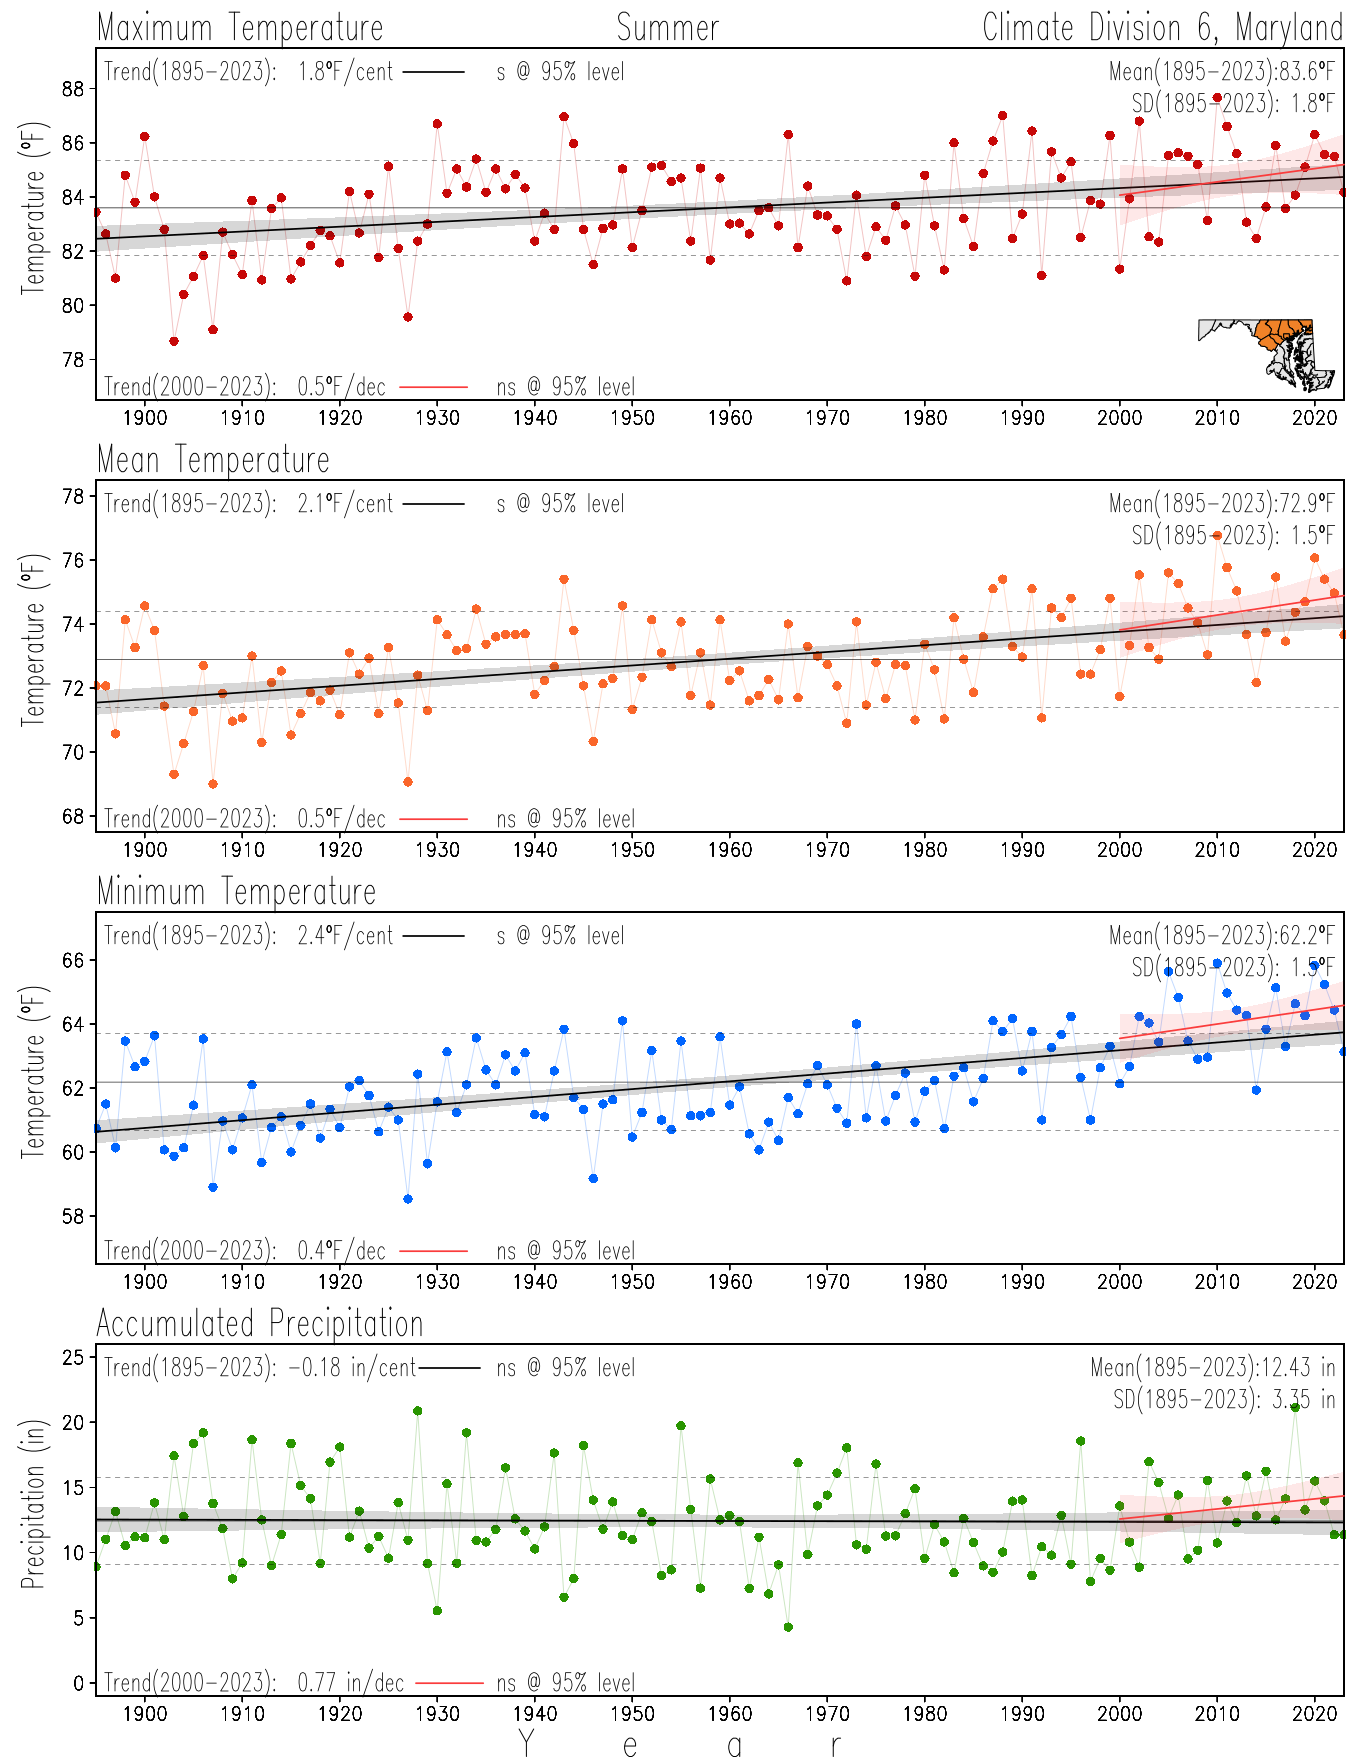
The following figures display the historical data for Climate Division 6 (North Central), Maryland from 1985 to 2023. The figures display time series of area-averaged surface air mean, maximum, minimum temperatures and total precipitation over the climate division at annual, seasonal and monthly resolutions with supperposed linear trends for the whole period (1895 - 2023) and for the 21st century period (2000-2023). A summary figure of the monthly trends for the whole period is inlcuded at the bottom. Climate Division 6 includes the counties of Baltimore, Carroll, Cecil, Frederick, Harford, Howard, Montgomery and Baltimore City.
The figures are created from NCEI's NClimDiv data set, v1.0.0. Data labeled as scaled on December 9, 2024.
Climate Division 6 Temperatures (°F) & Total Precipitation (in)
1895-2023
Annual
Seasonal
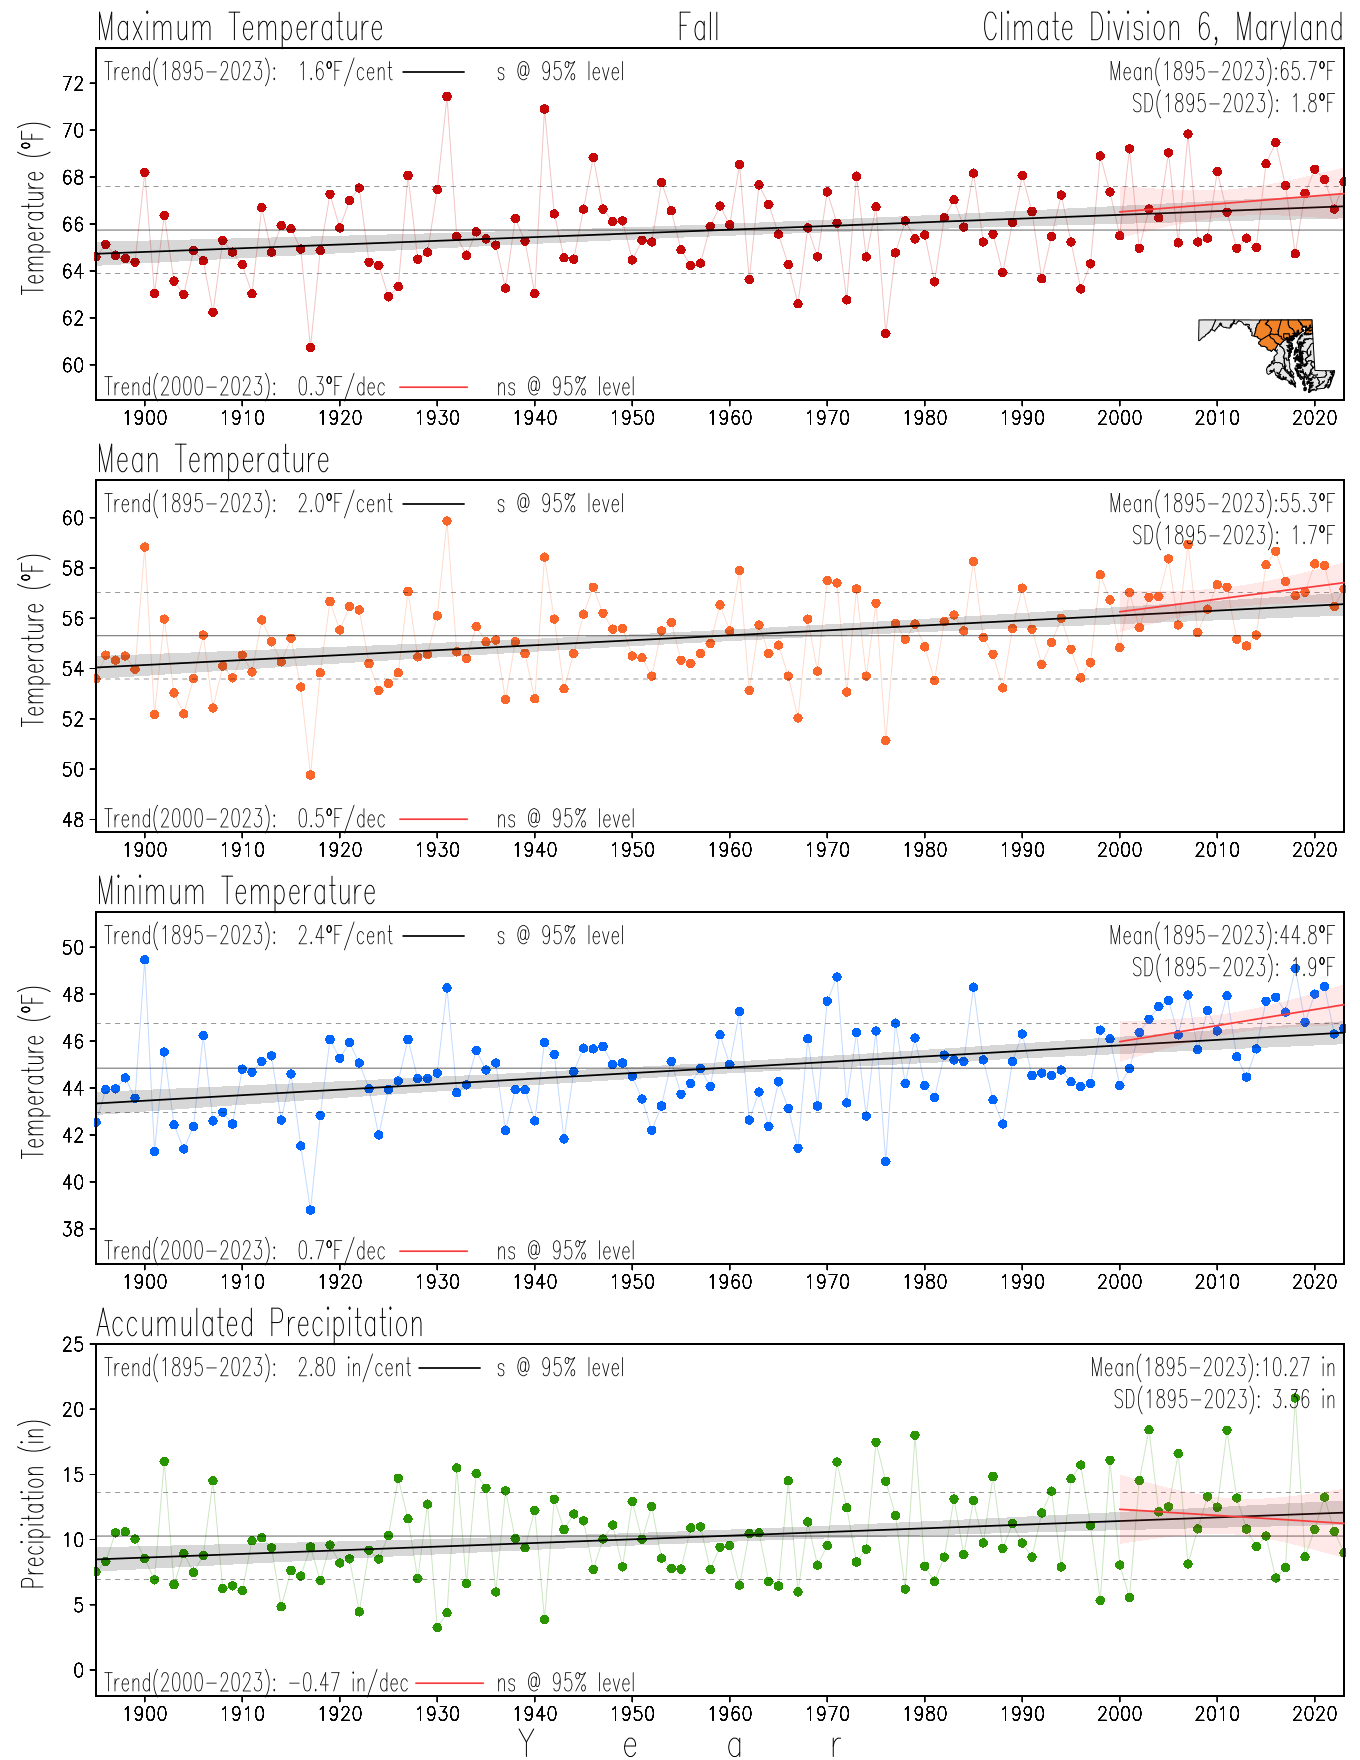
Monthly
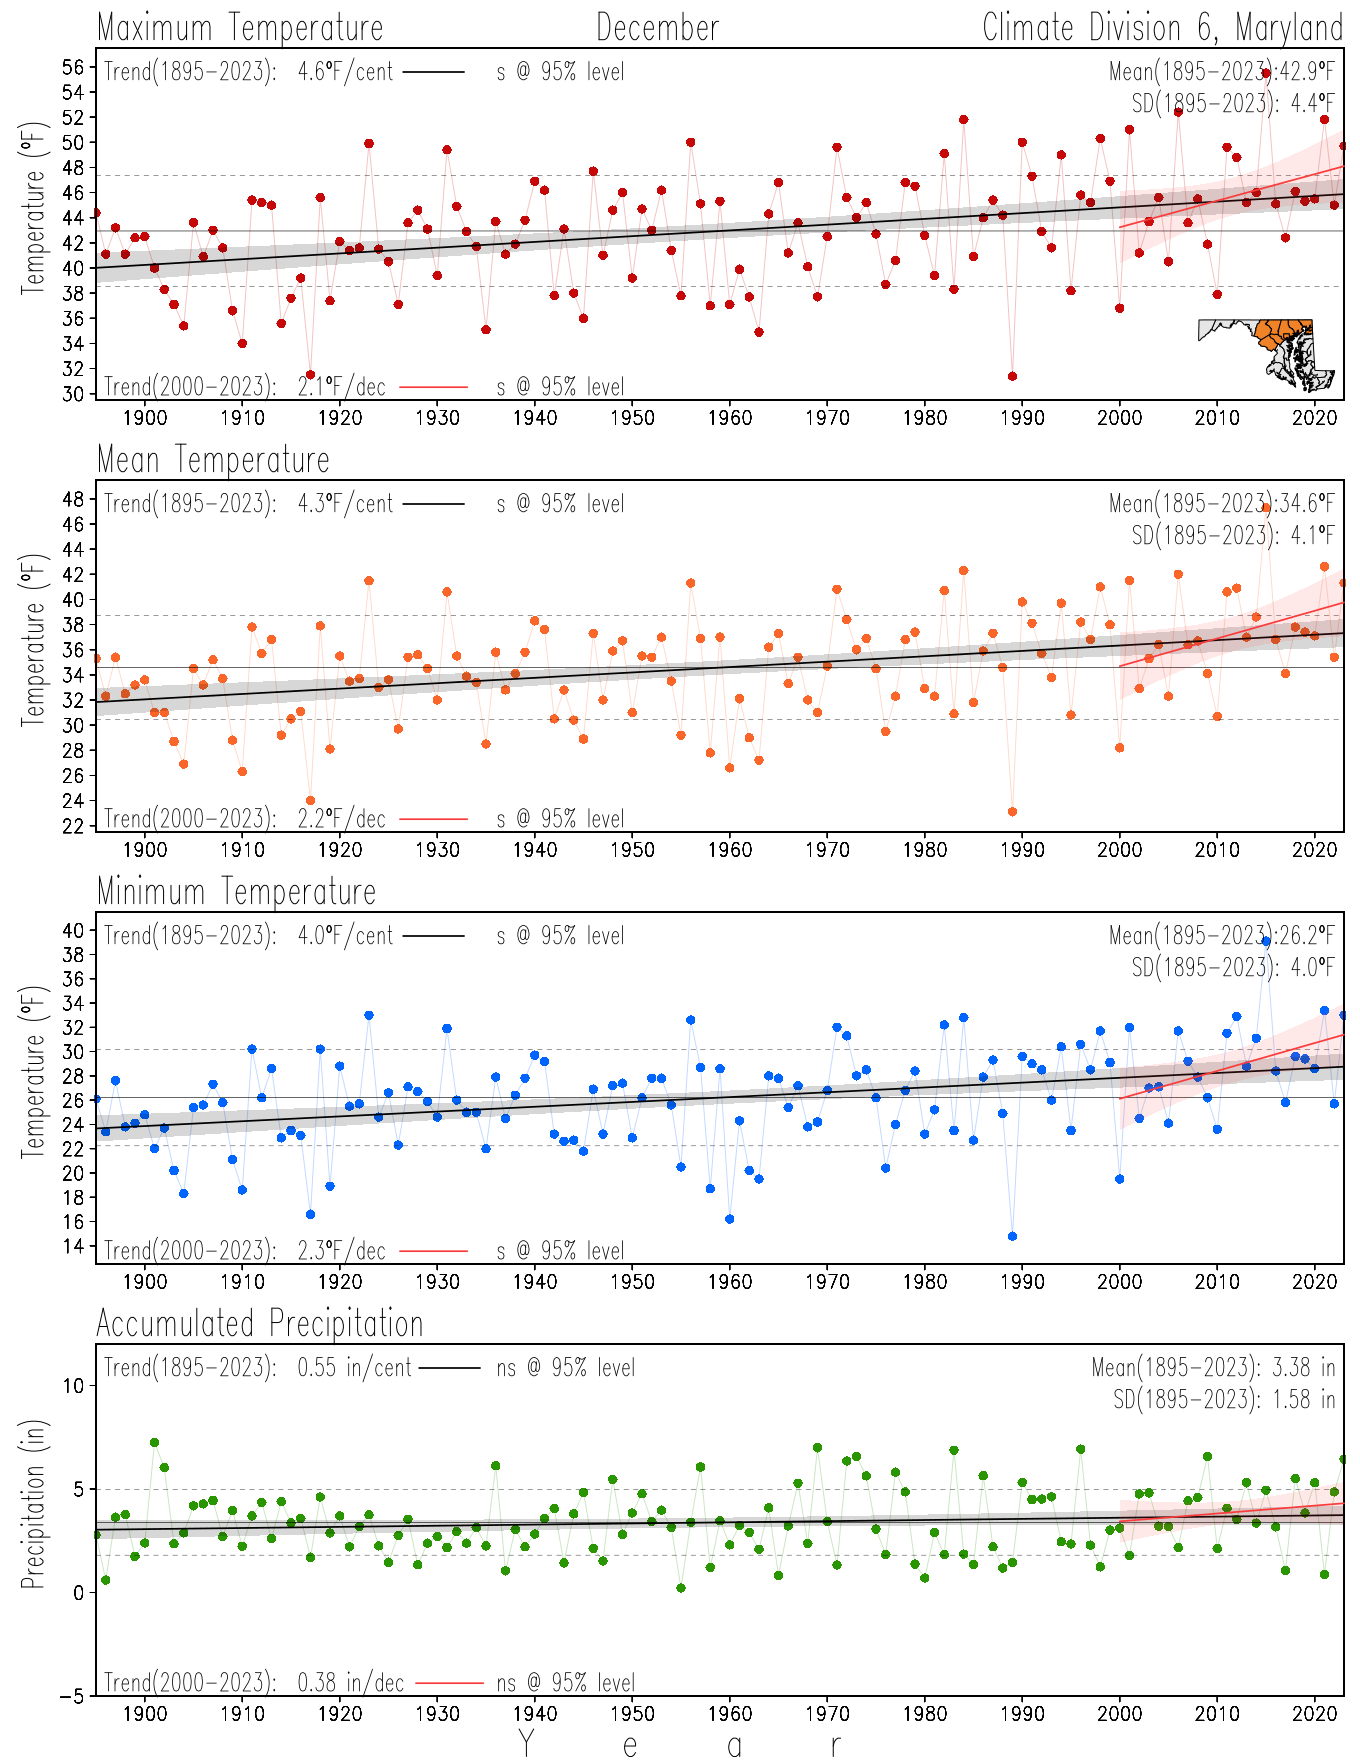
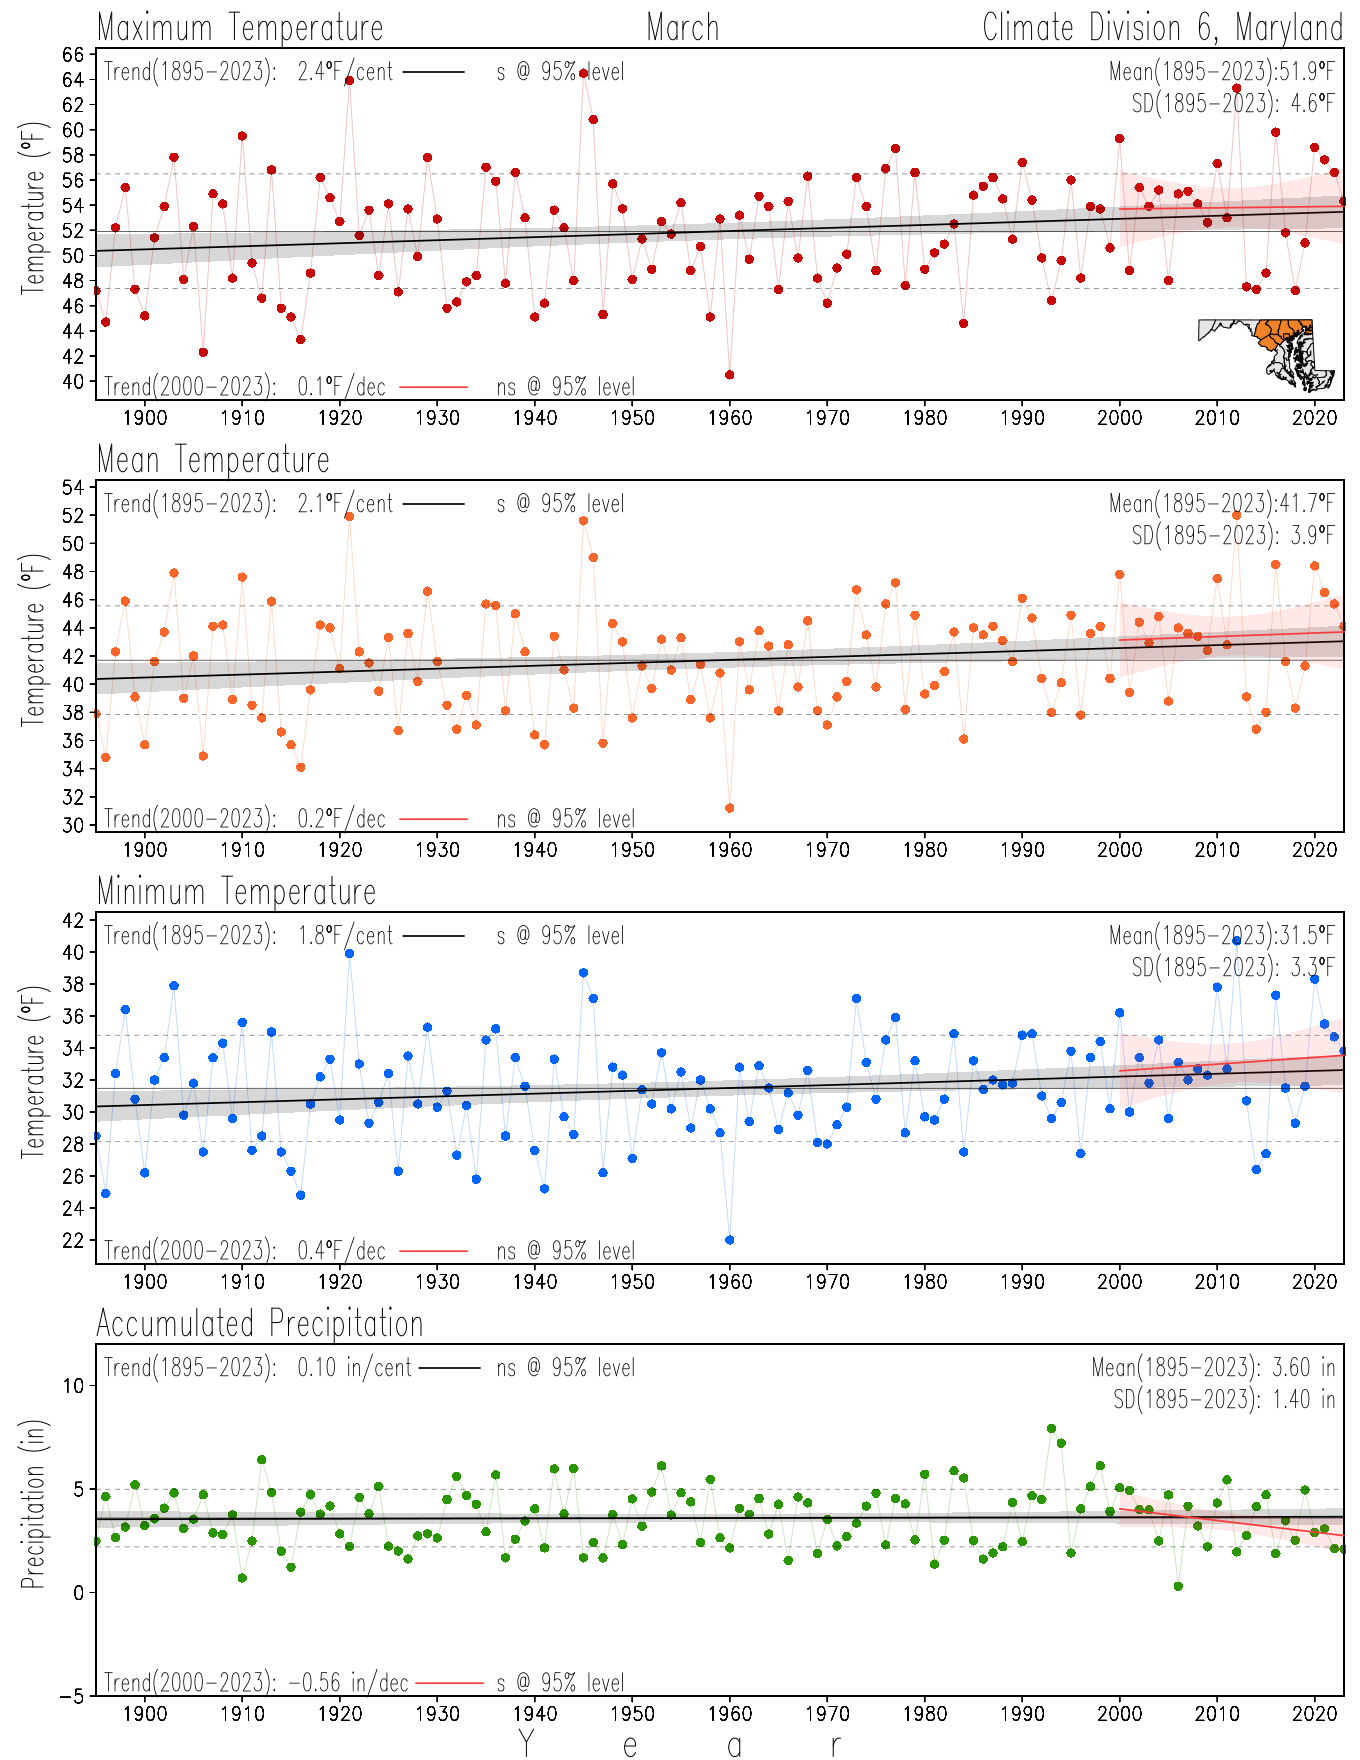
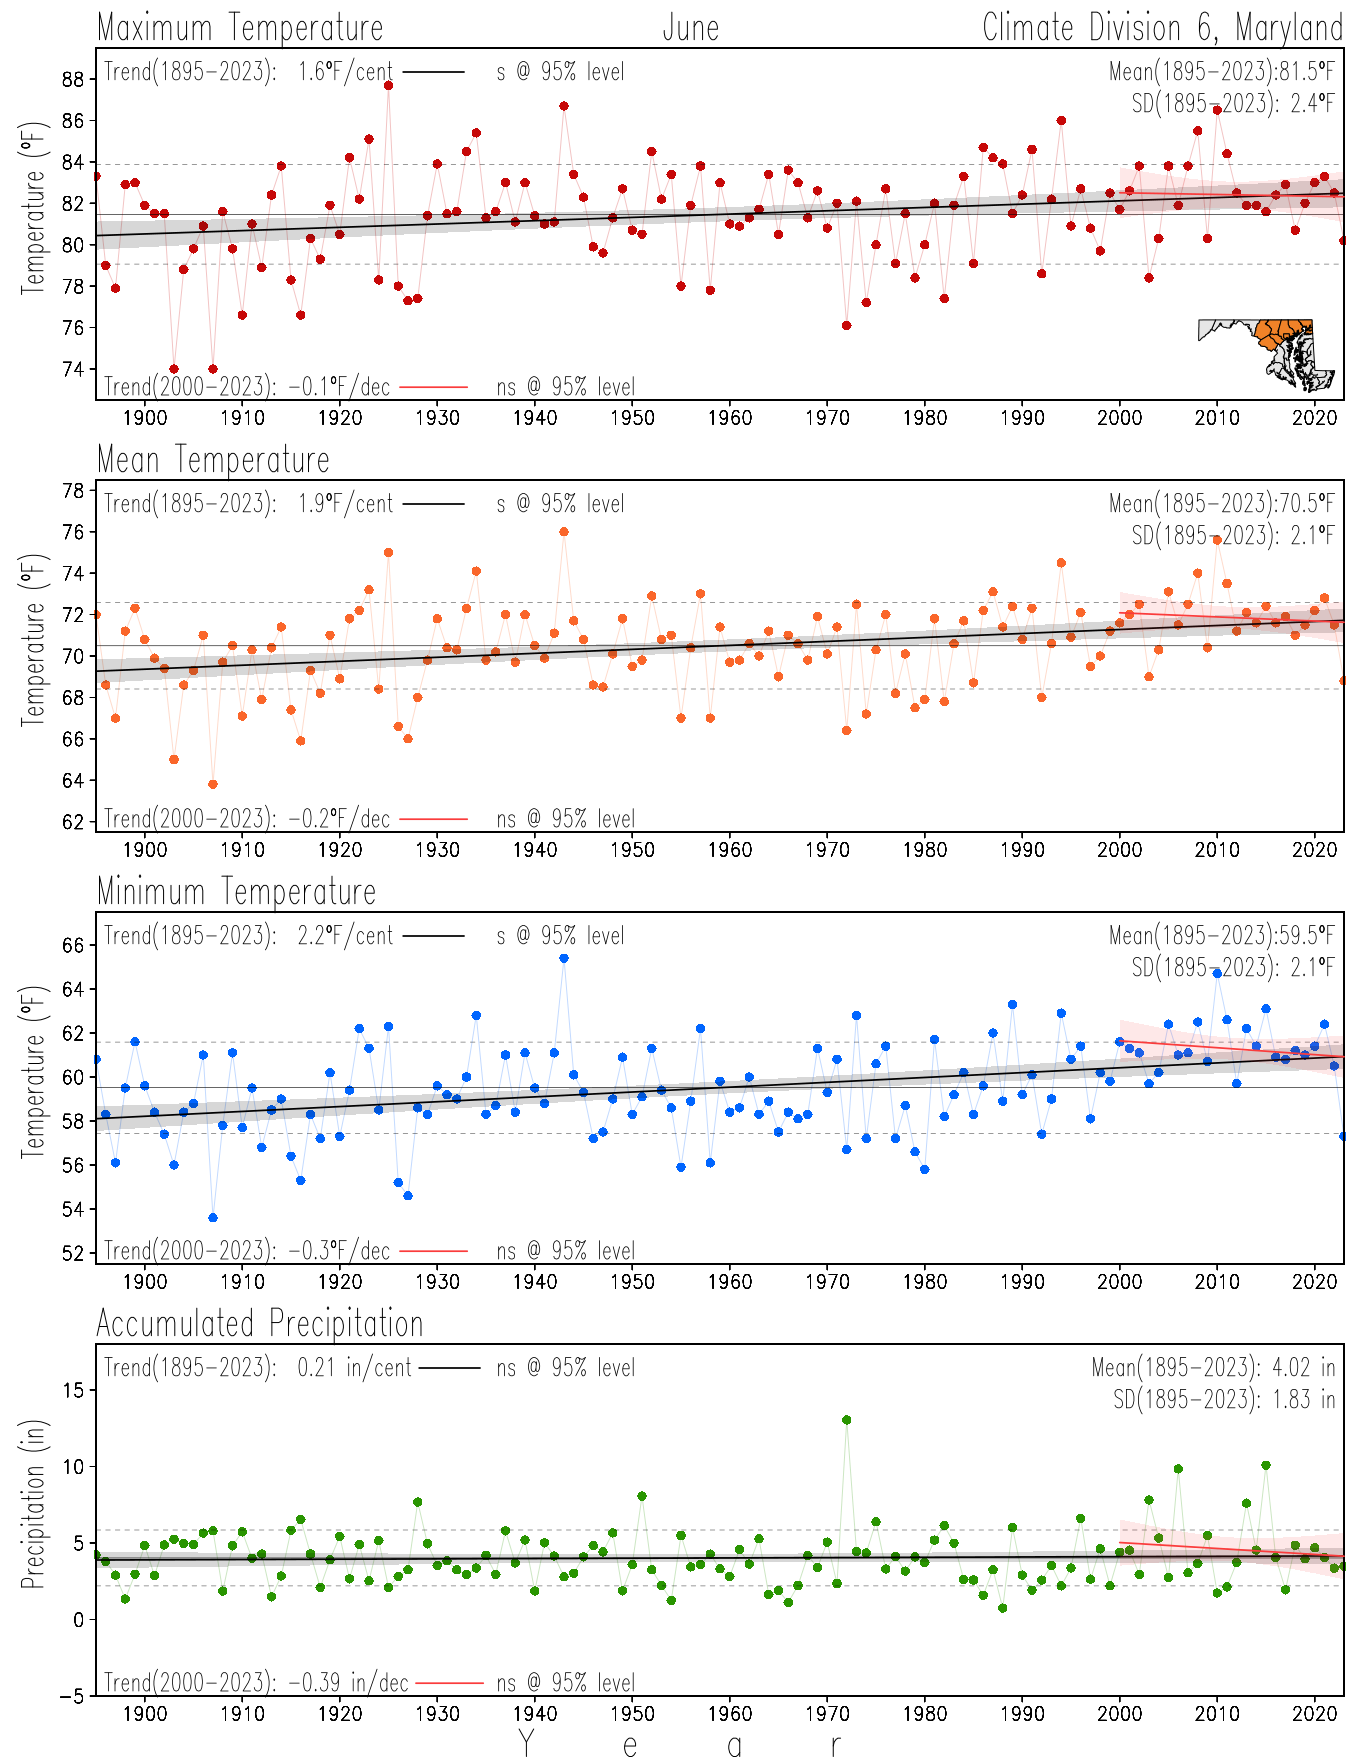
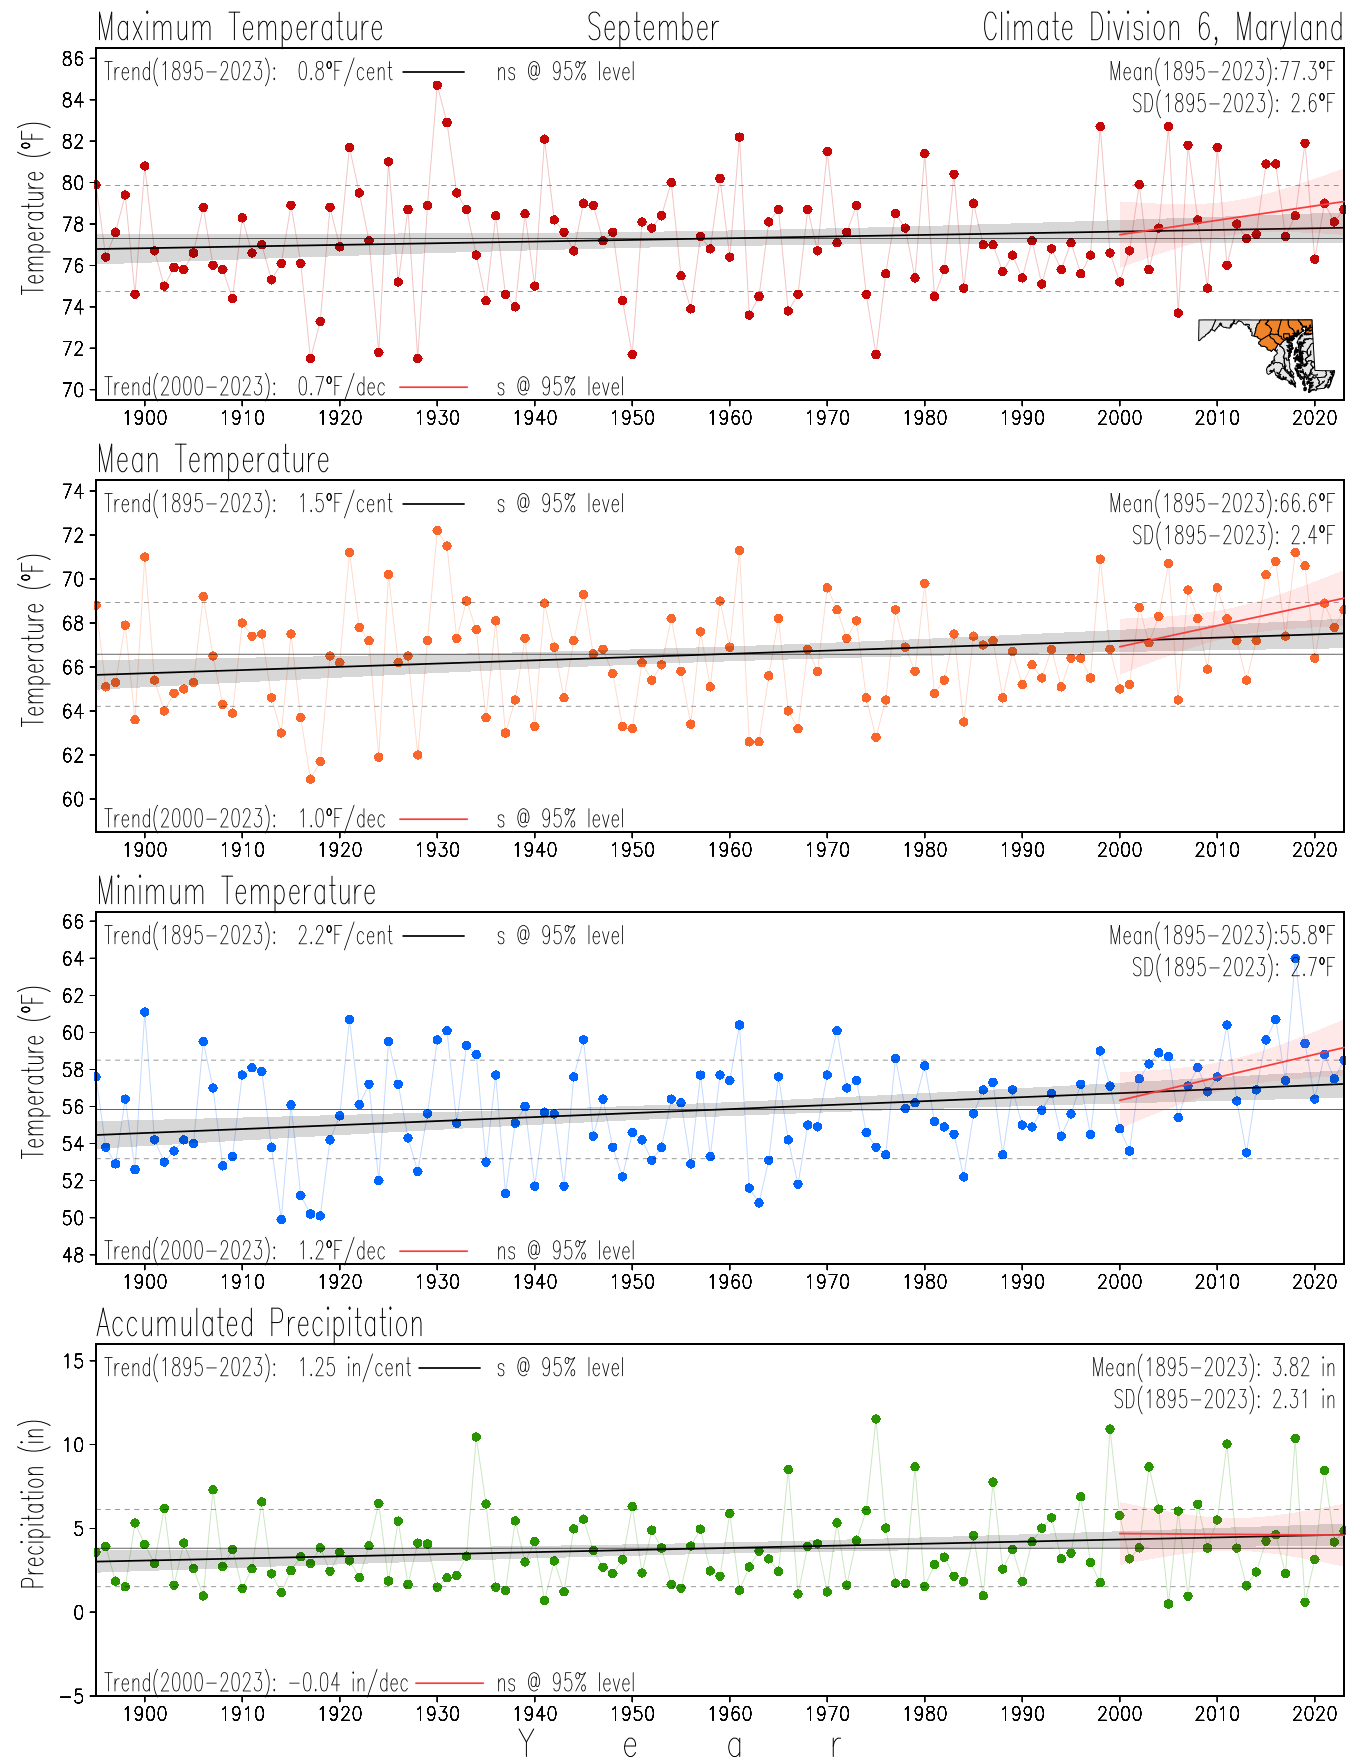
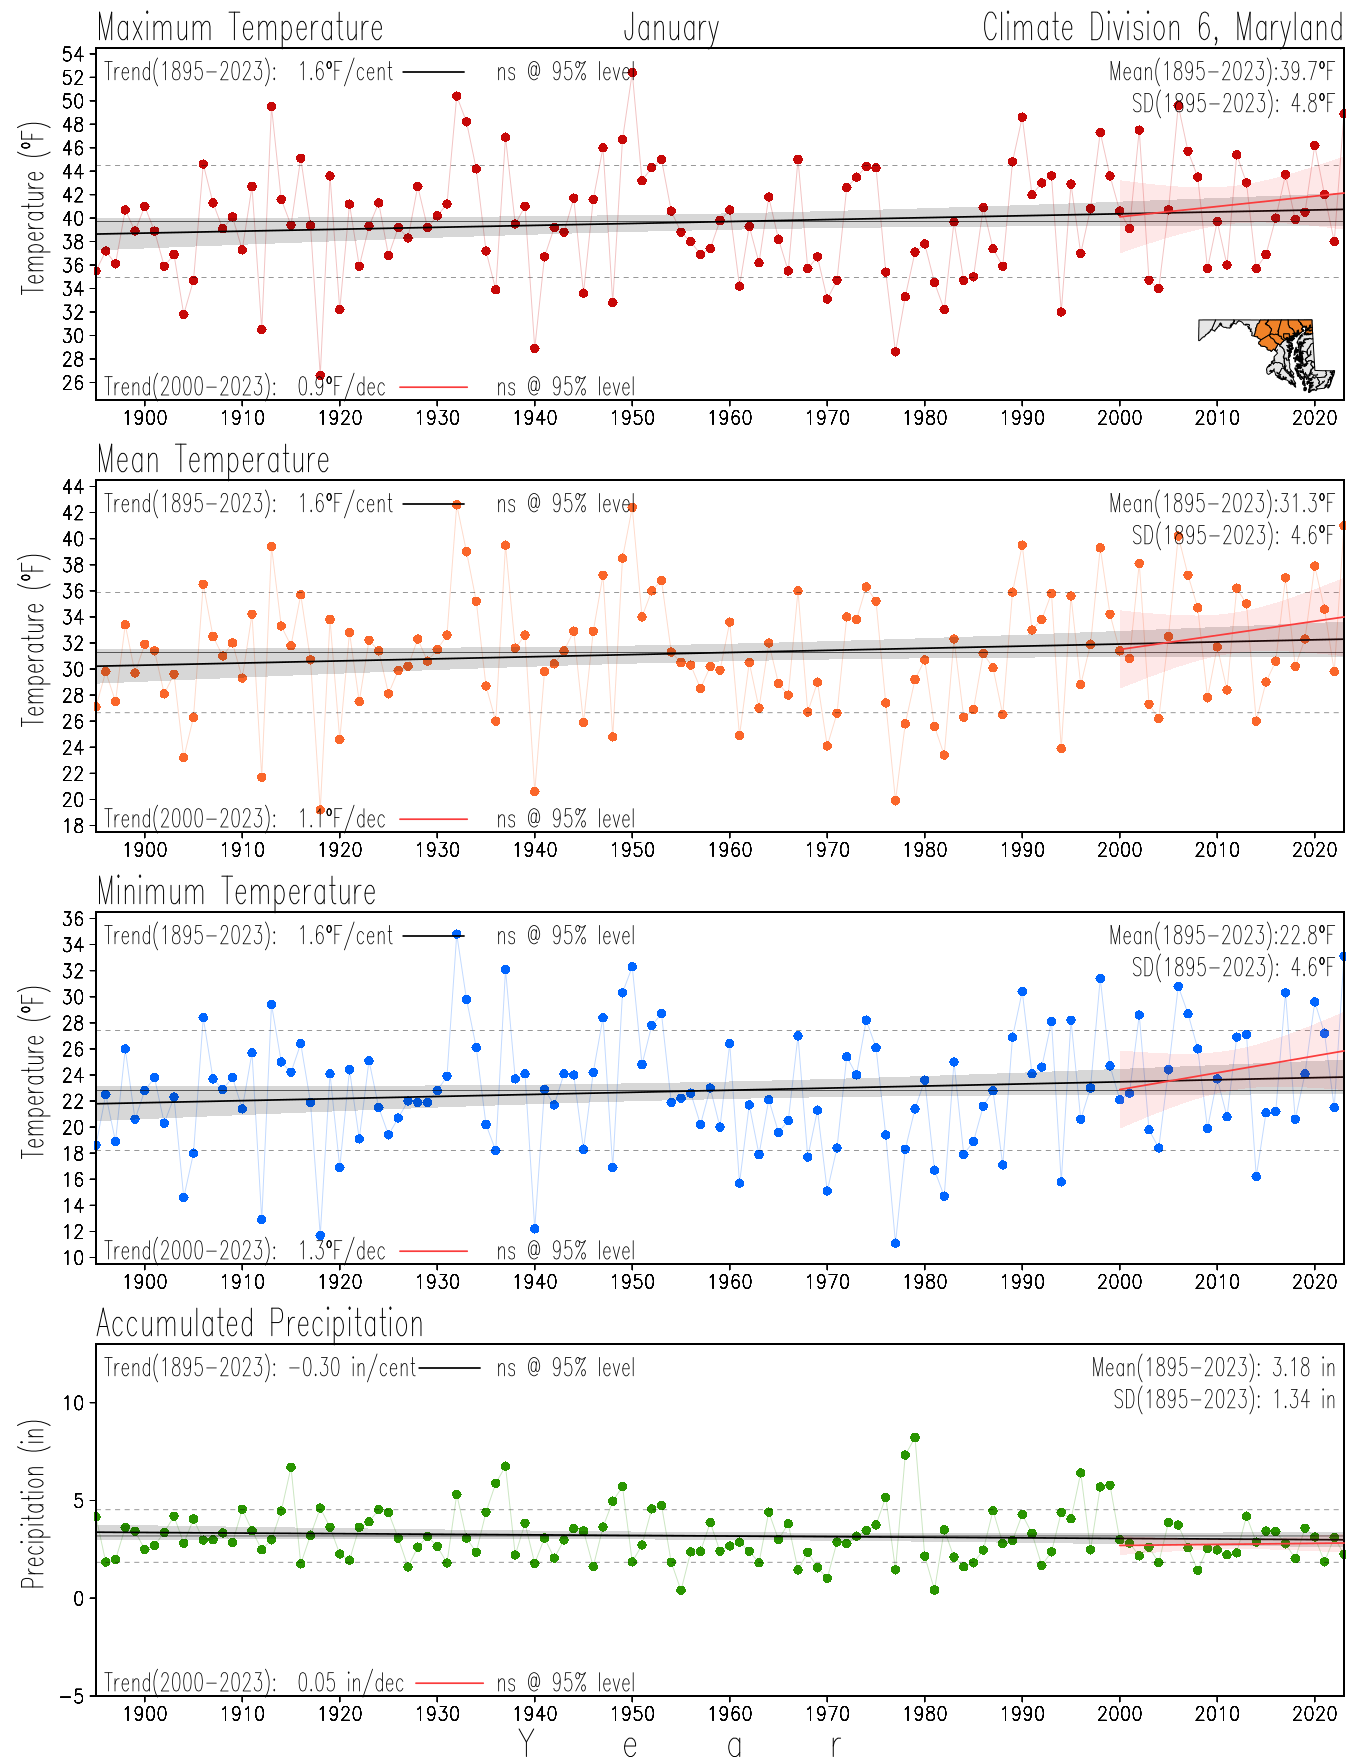
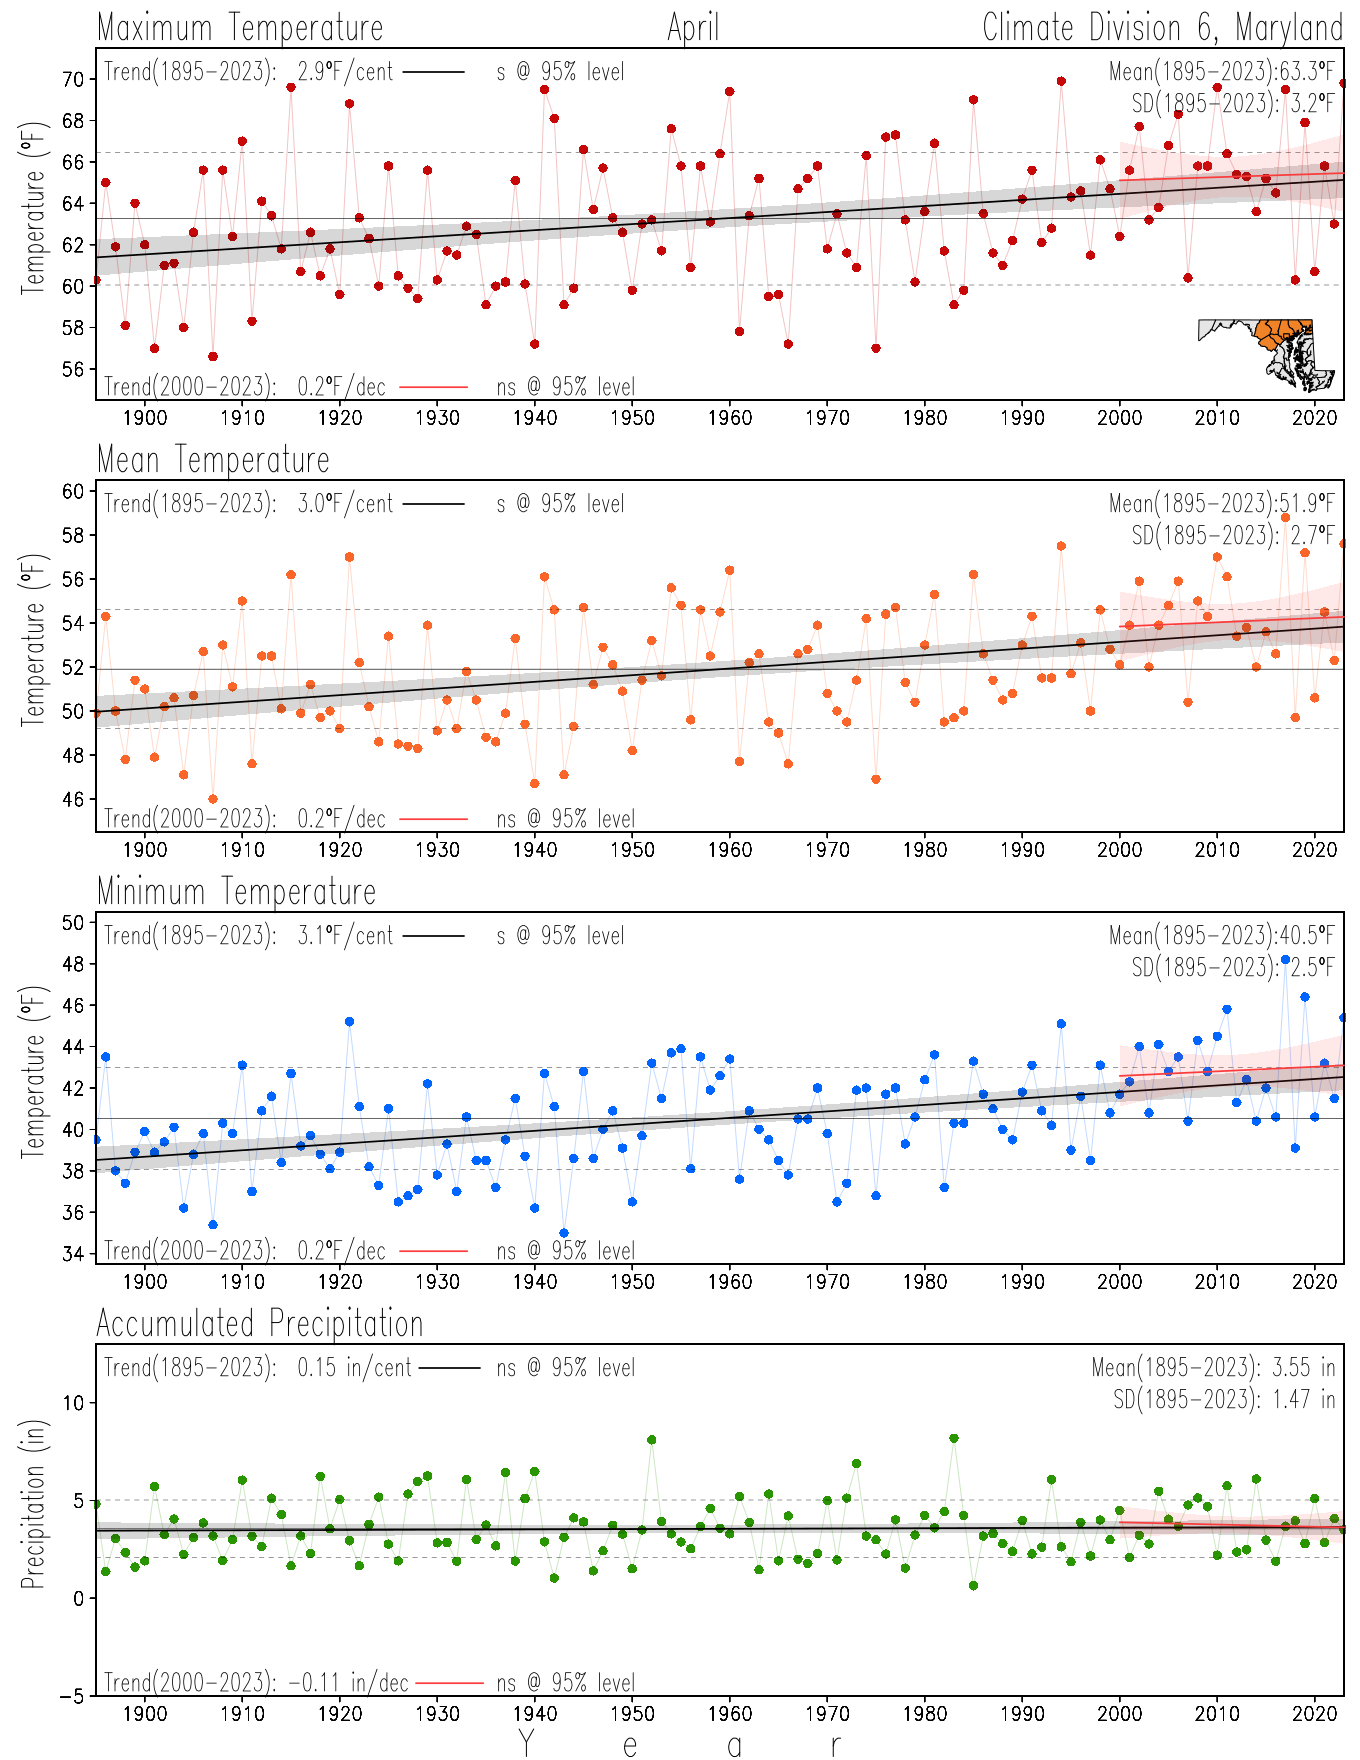
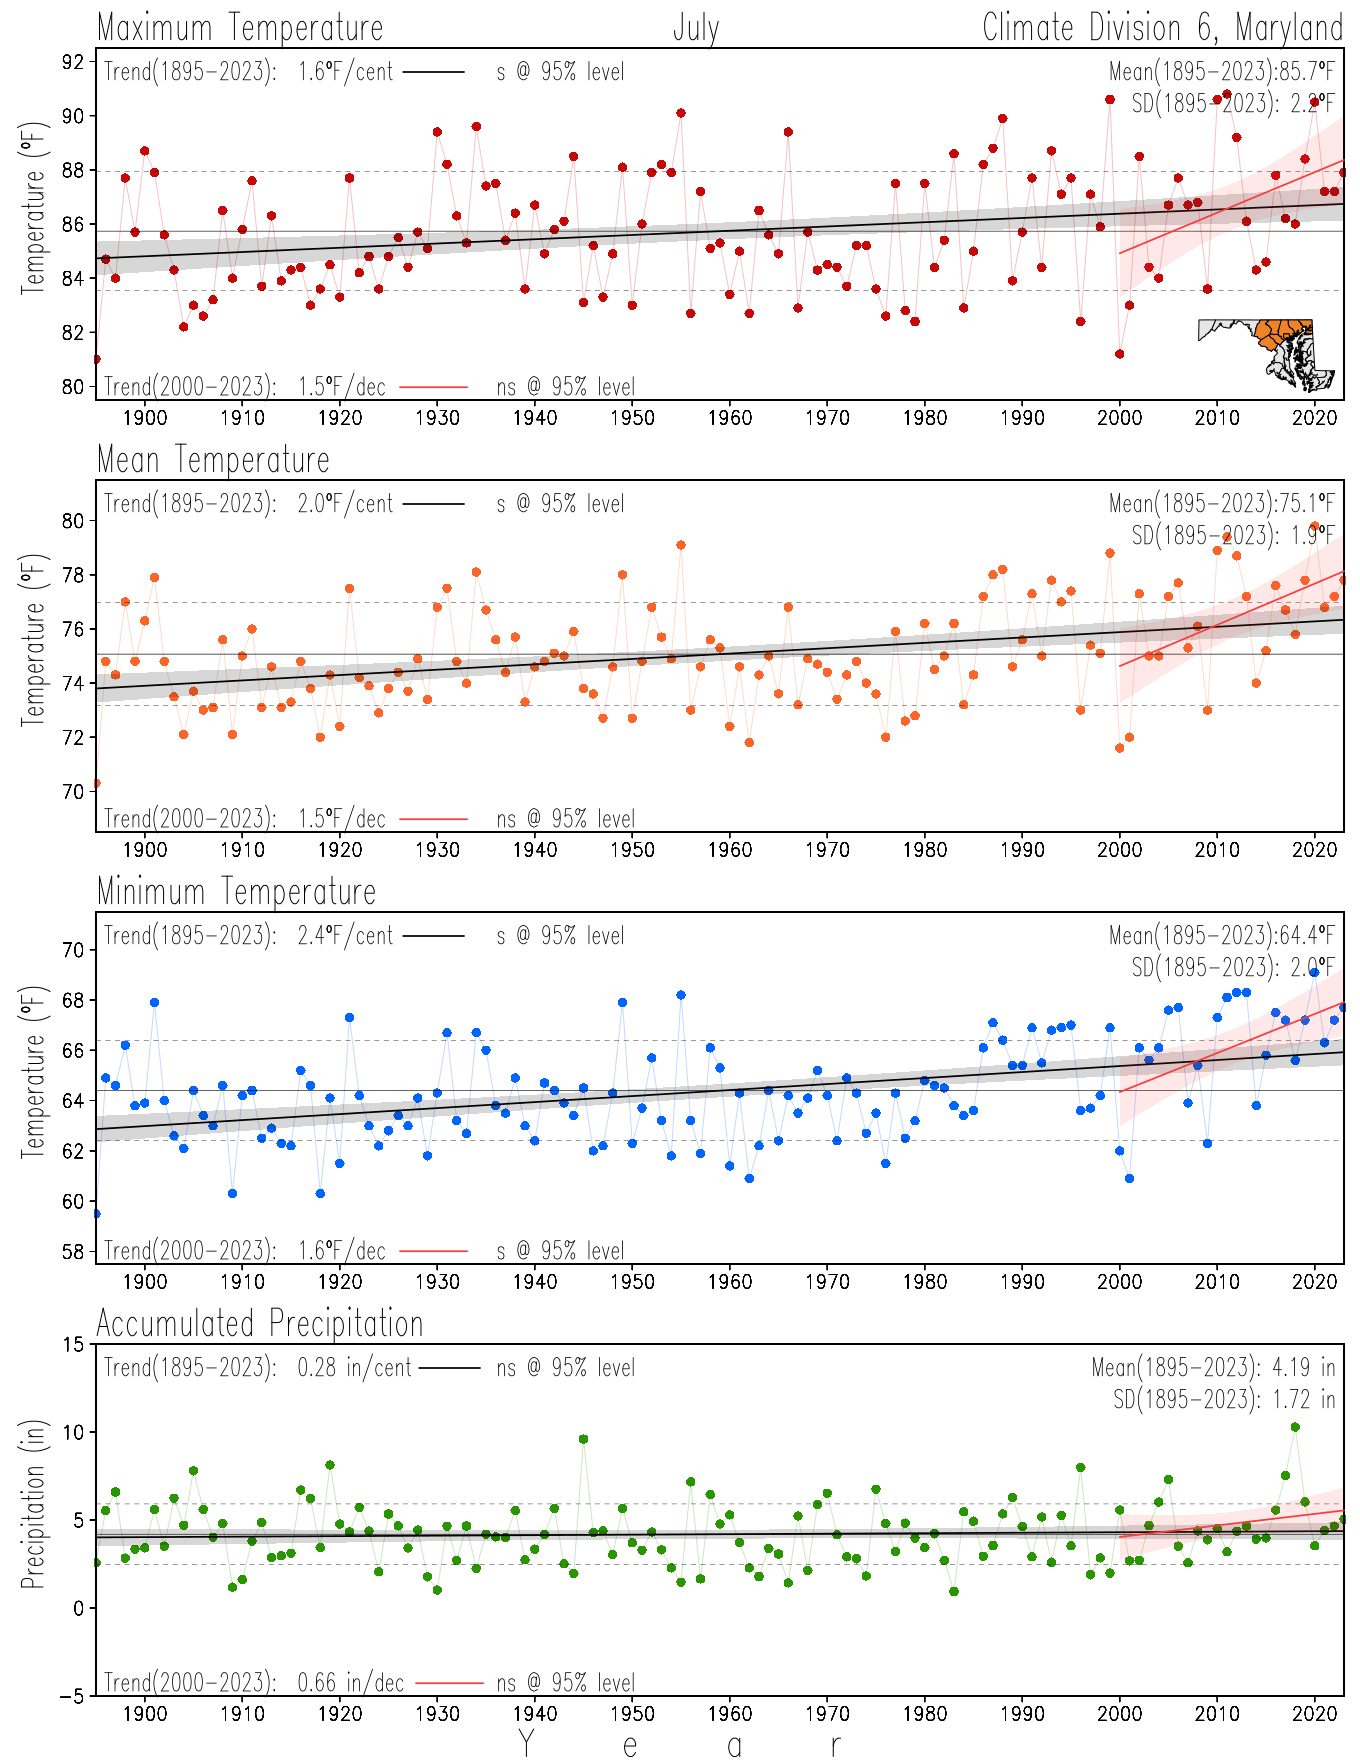
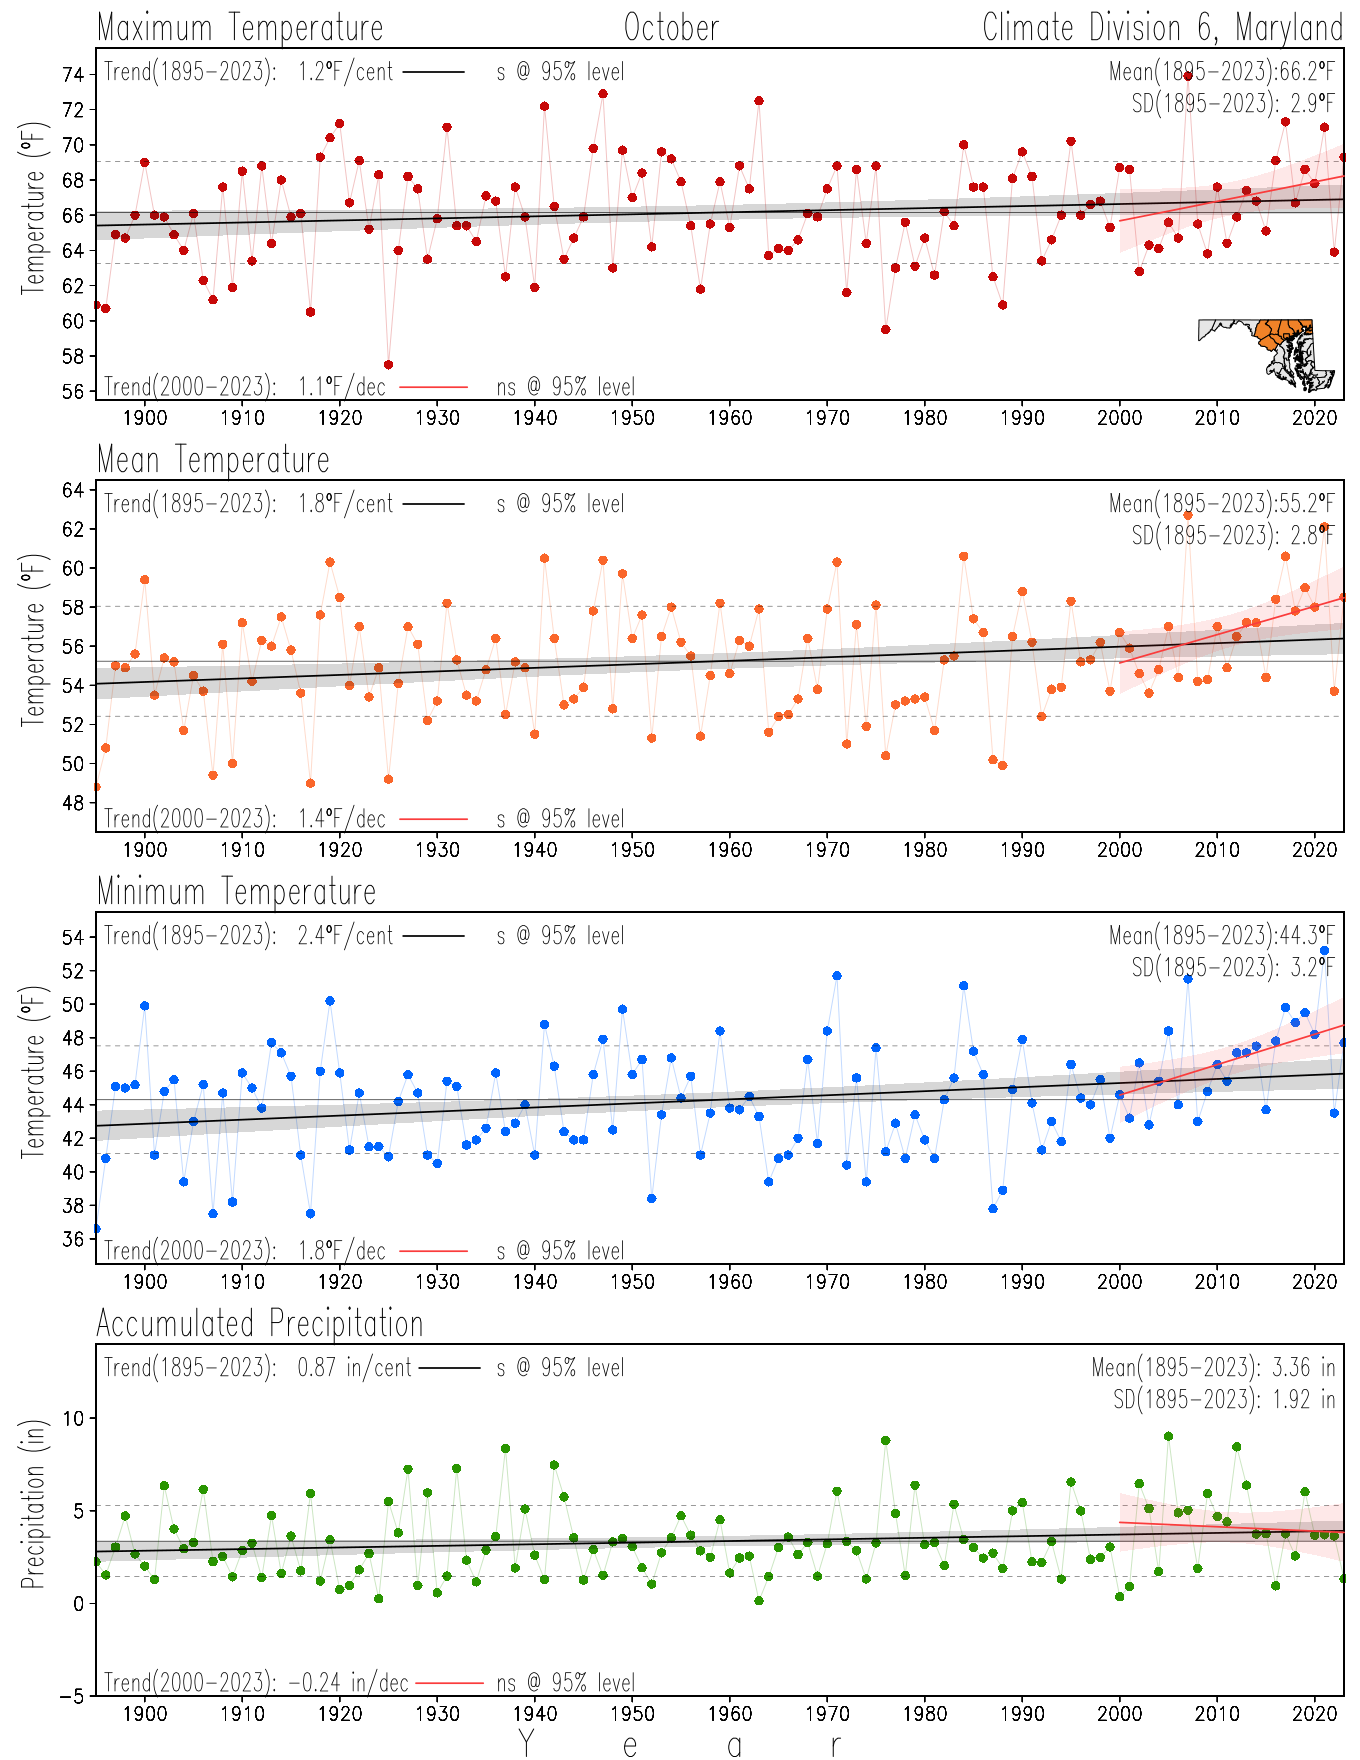
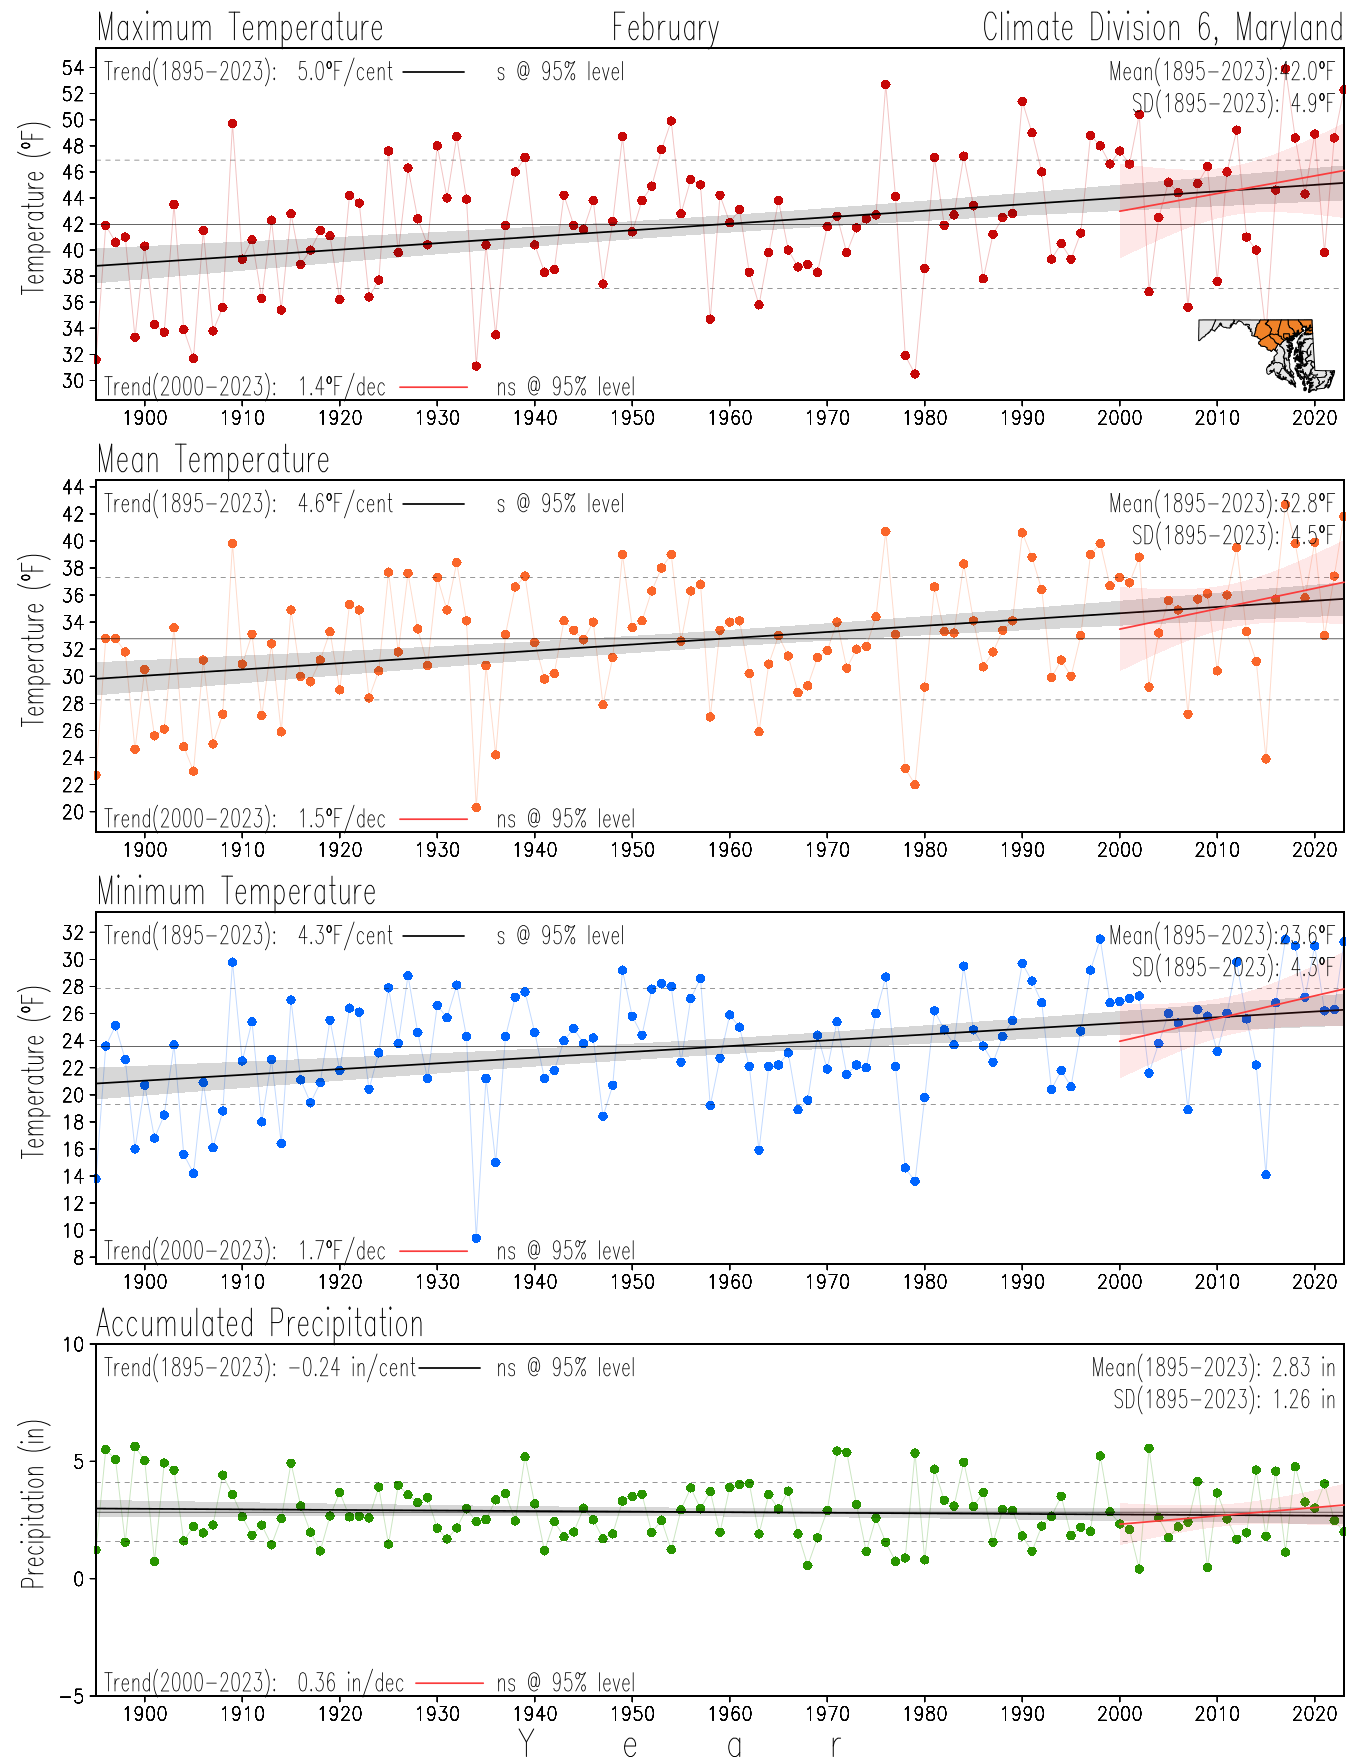
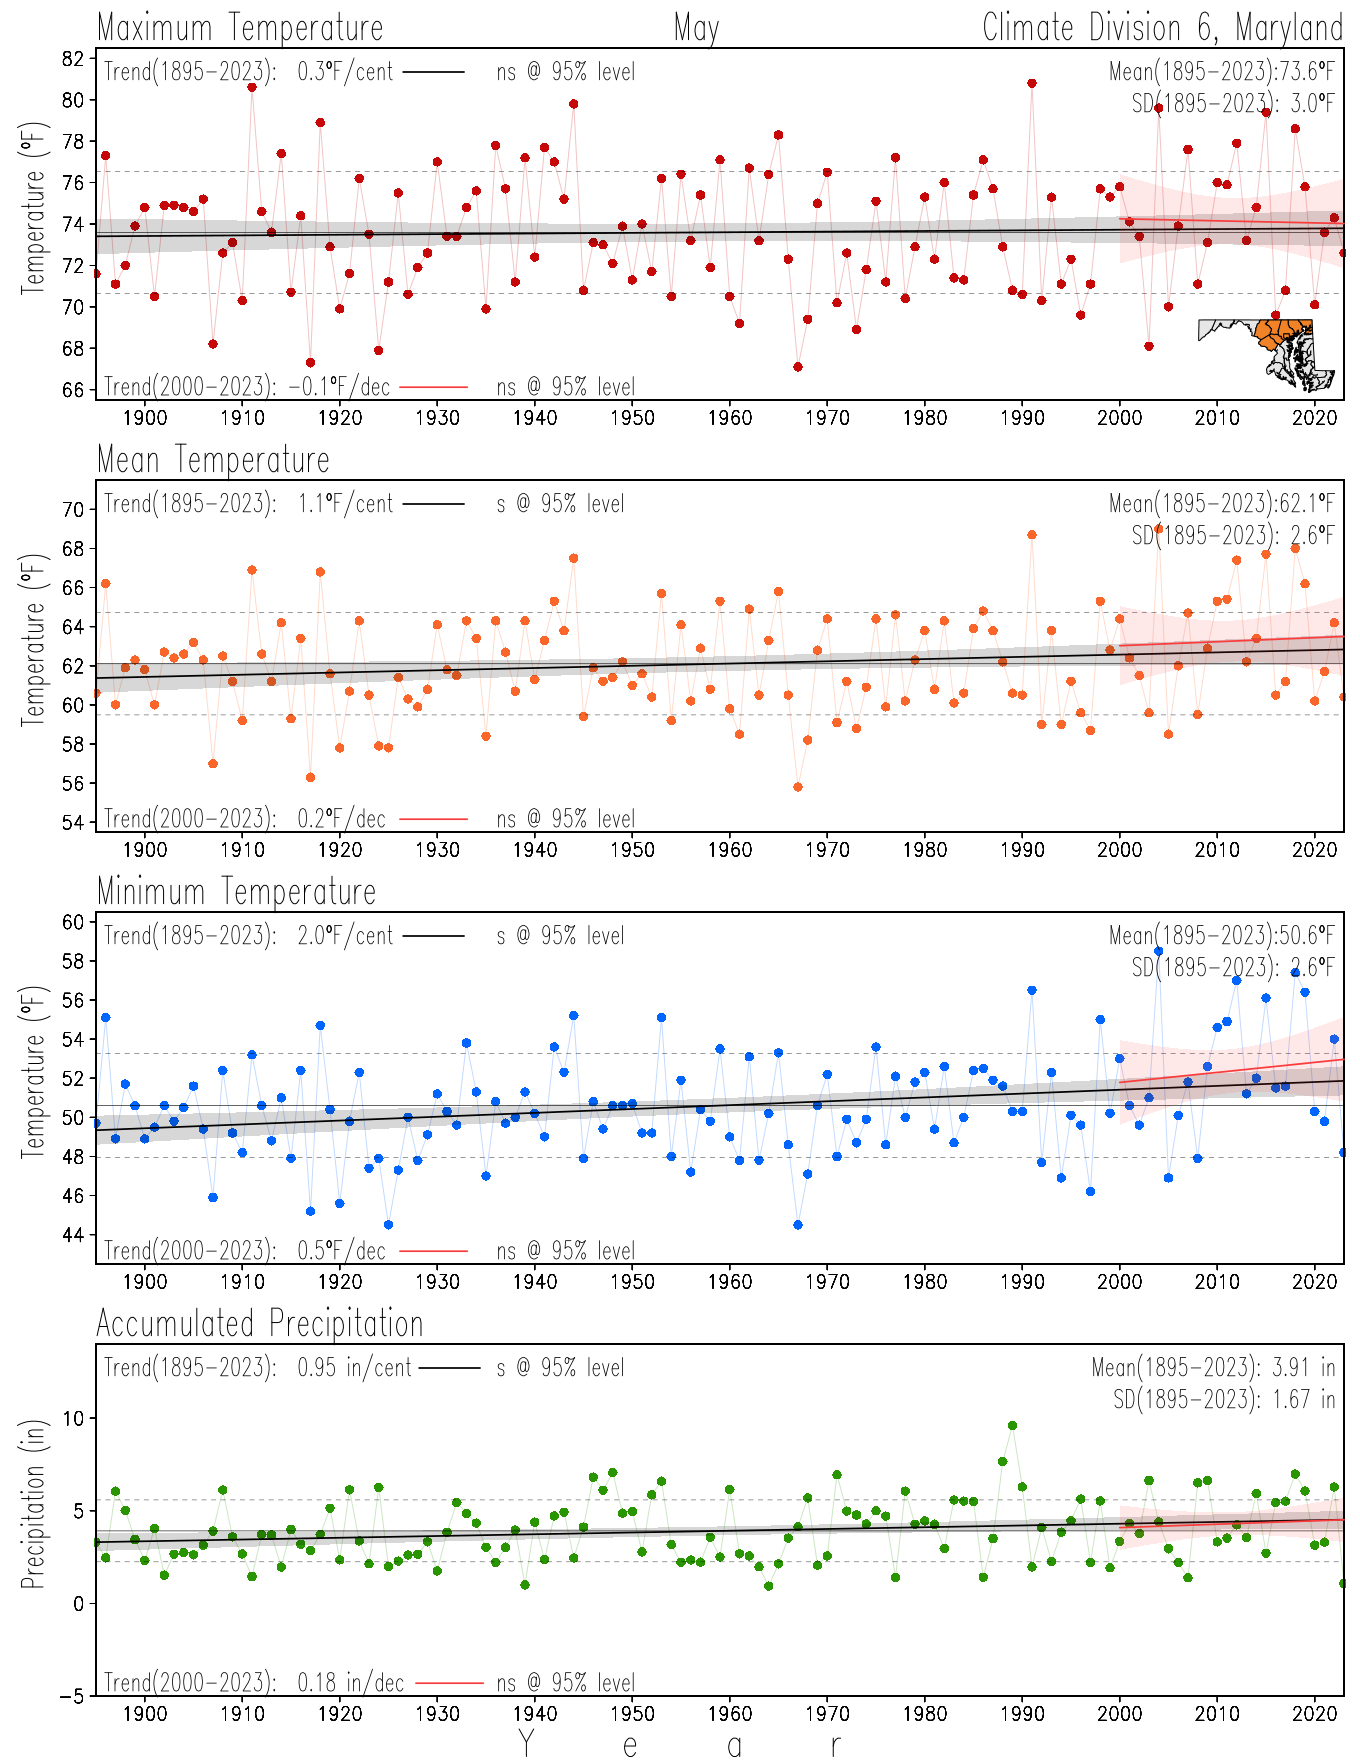
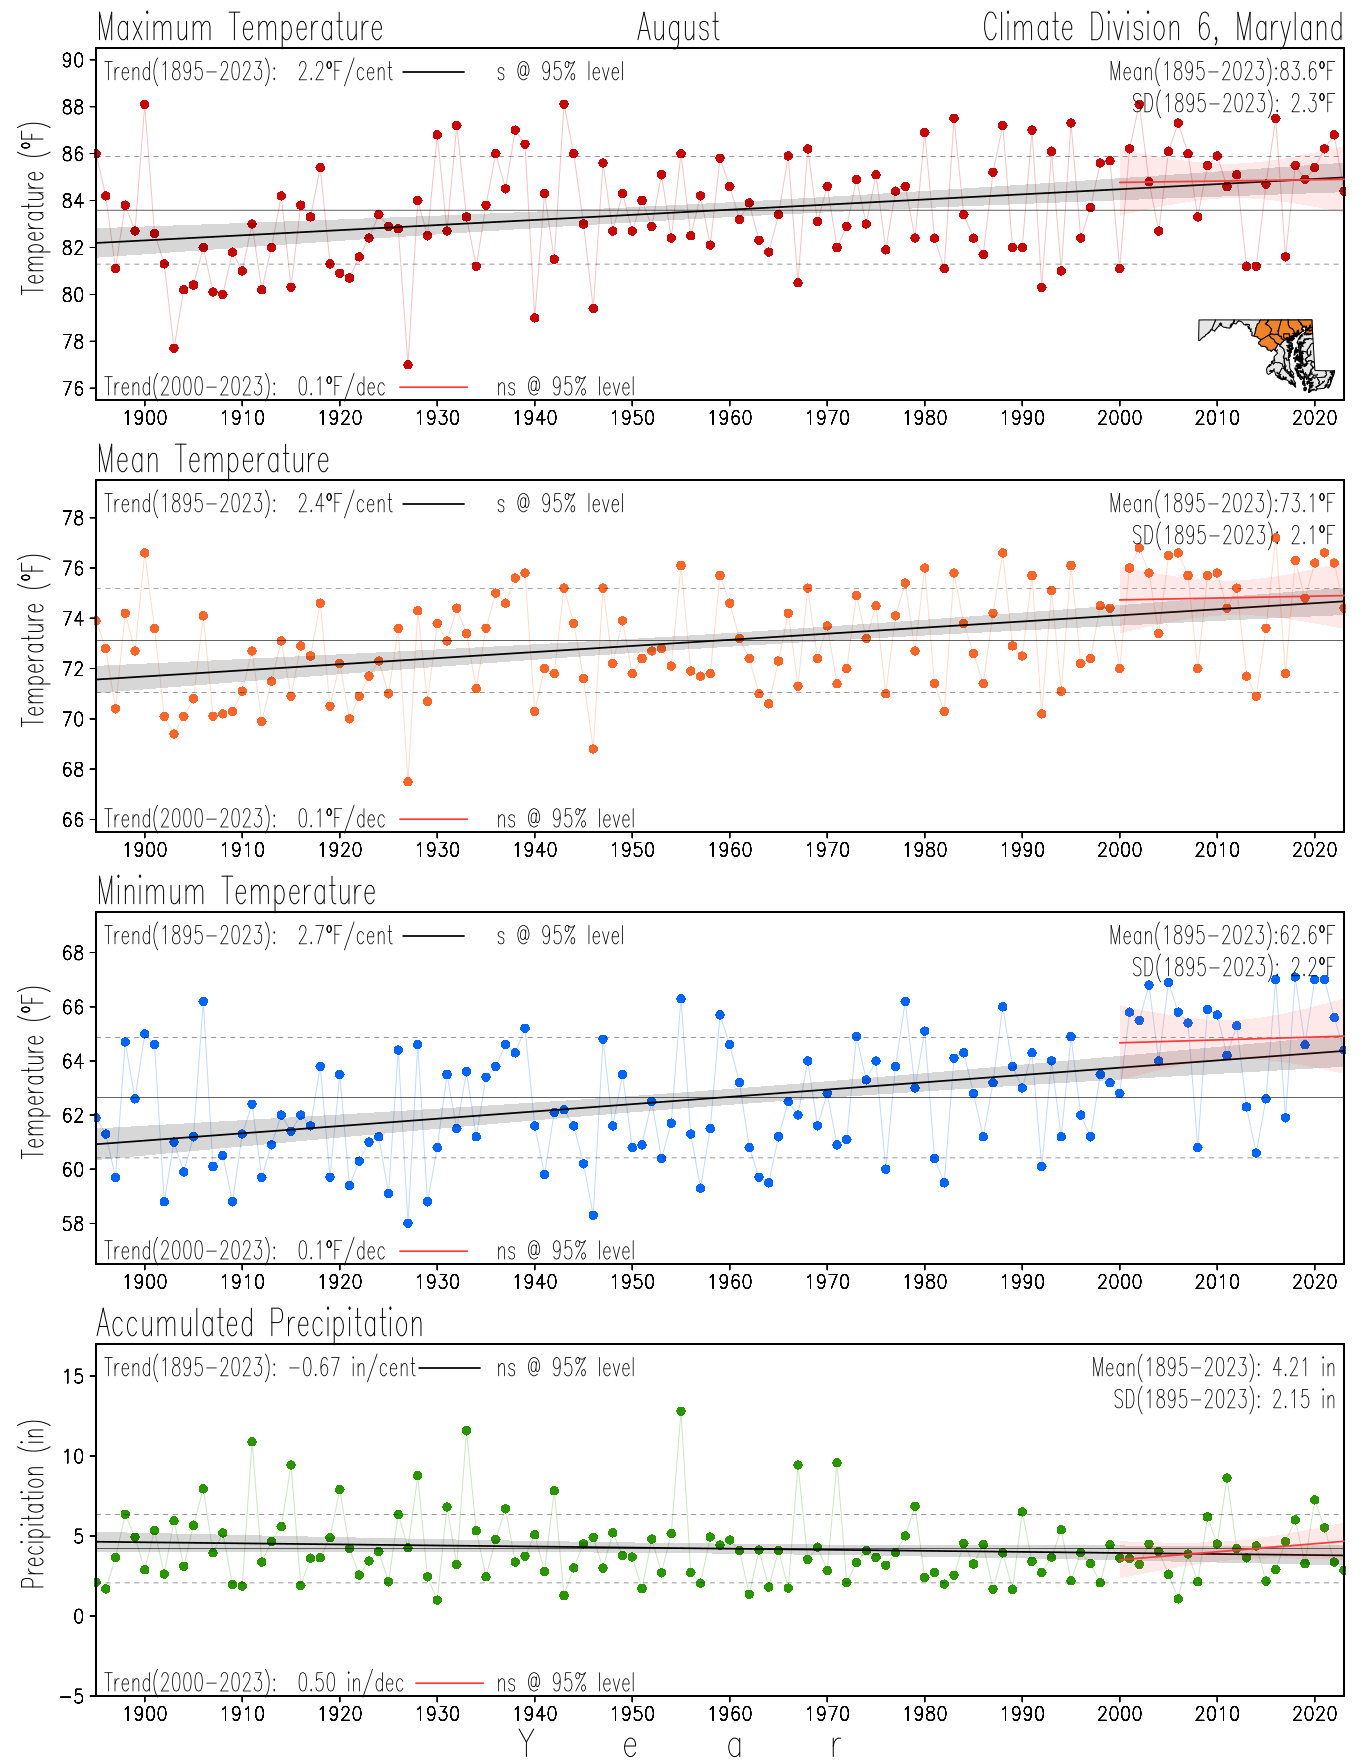
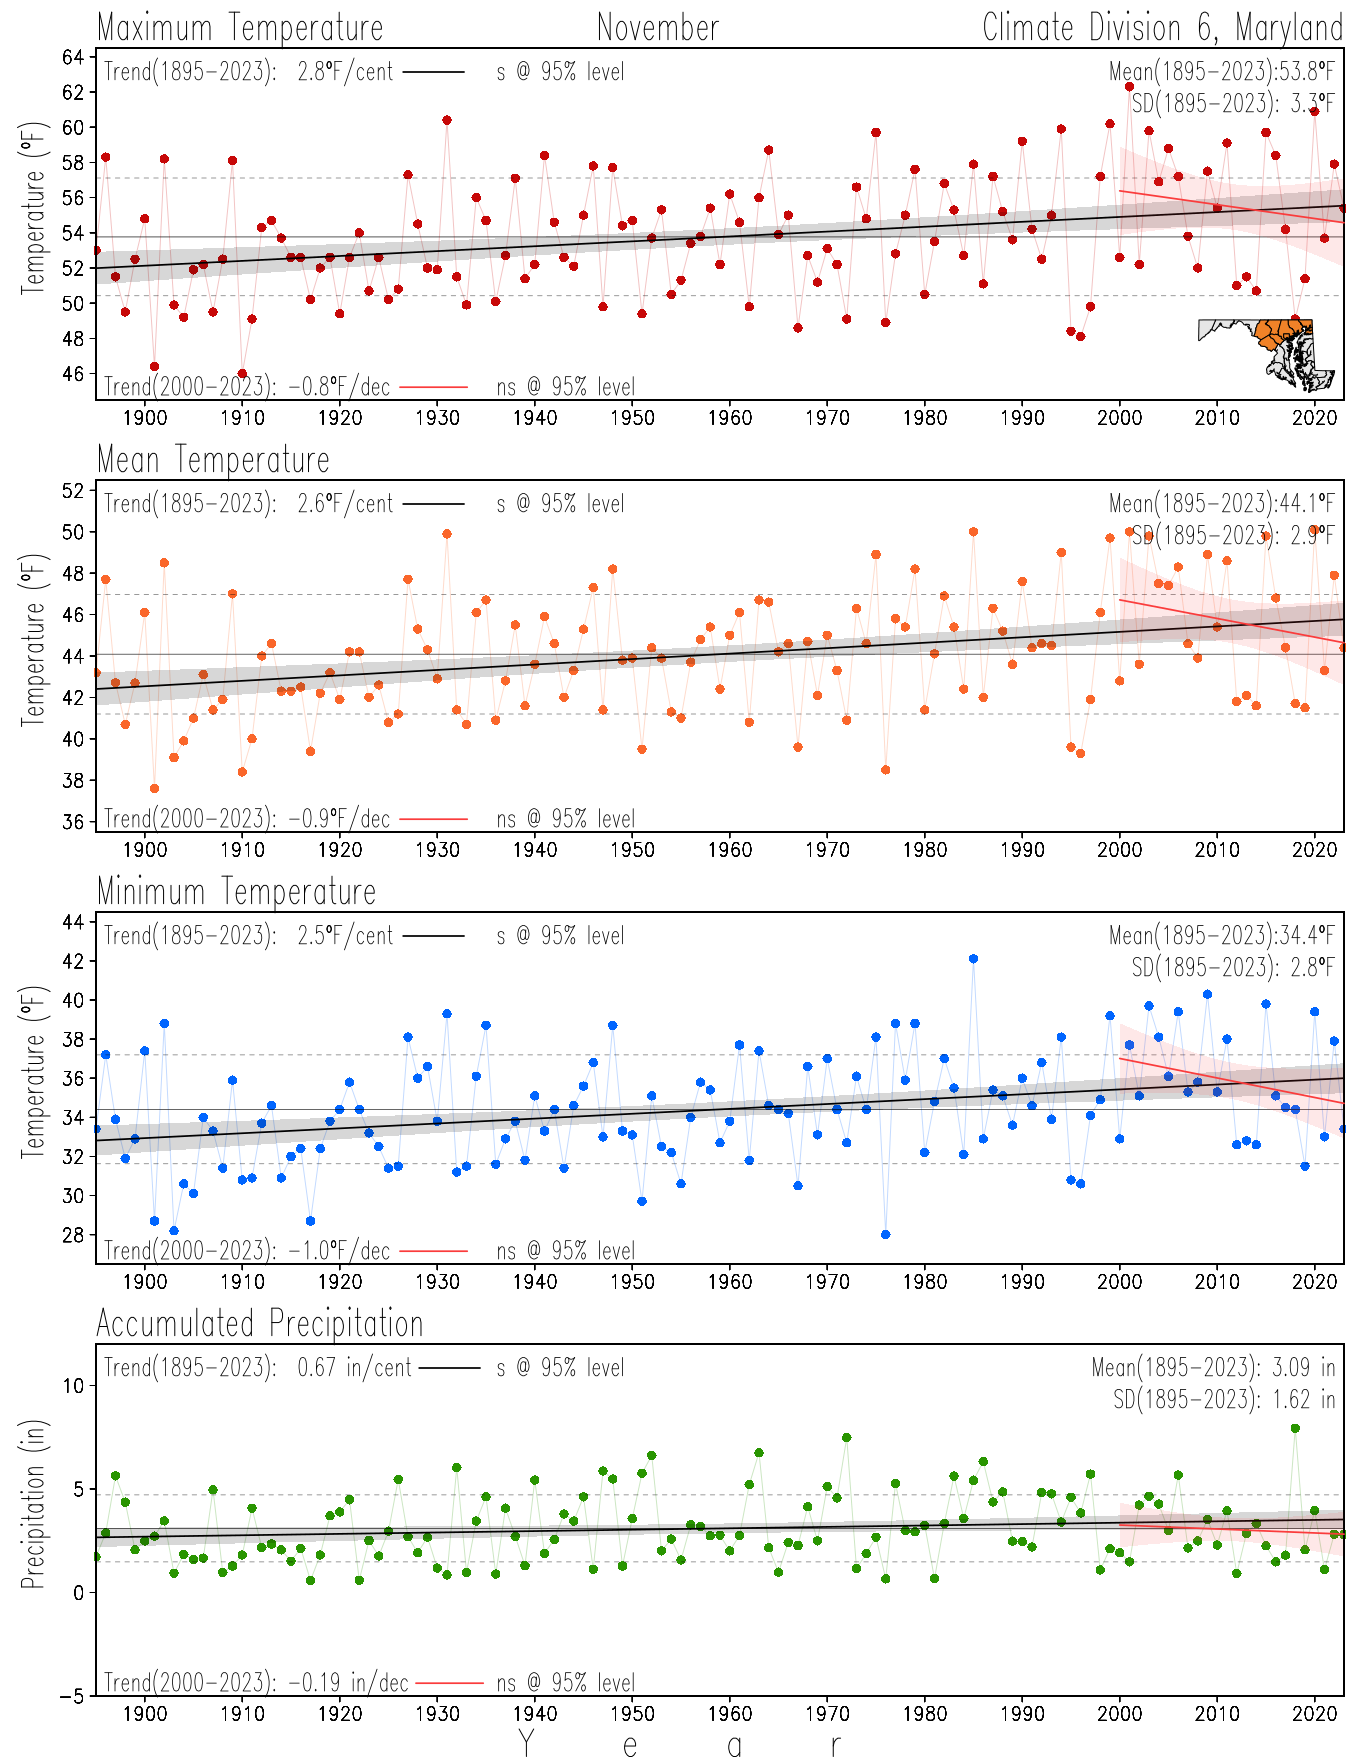
Monthly Trends, 1895-2023
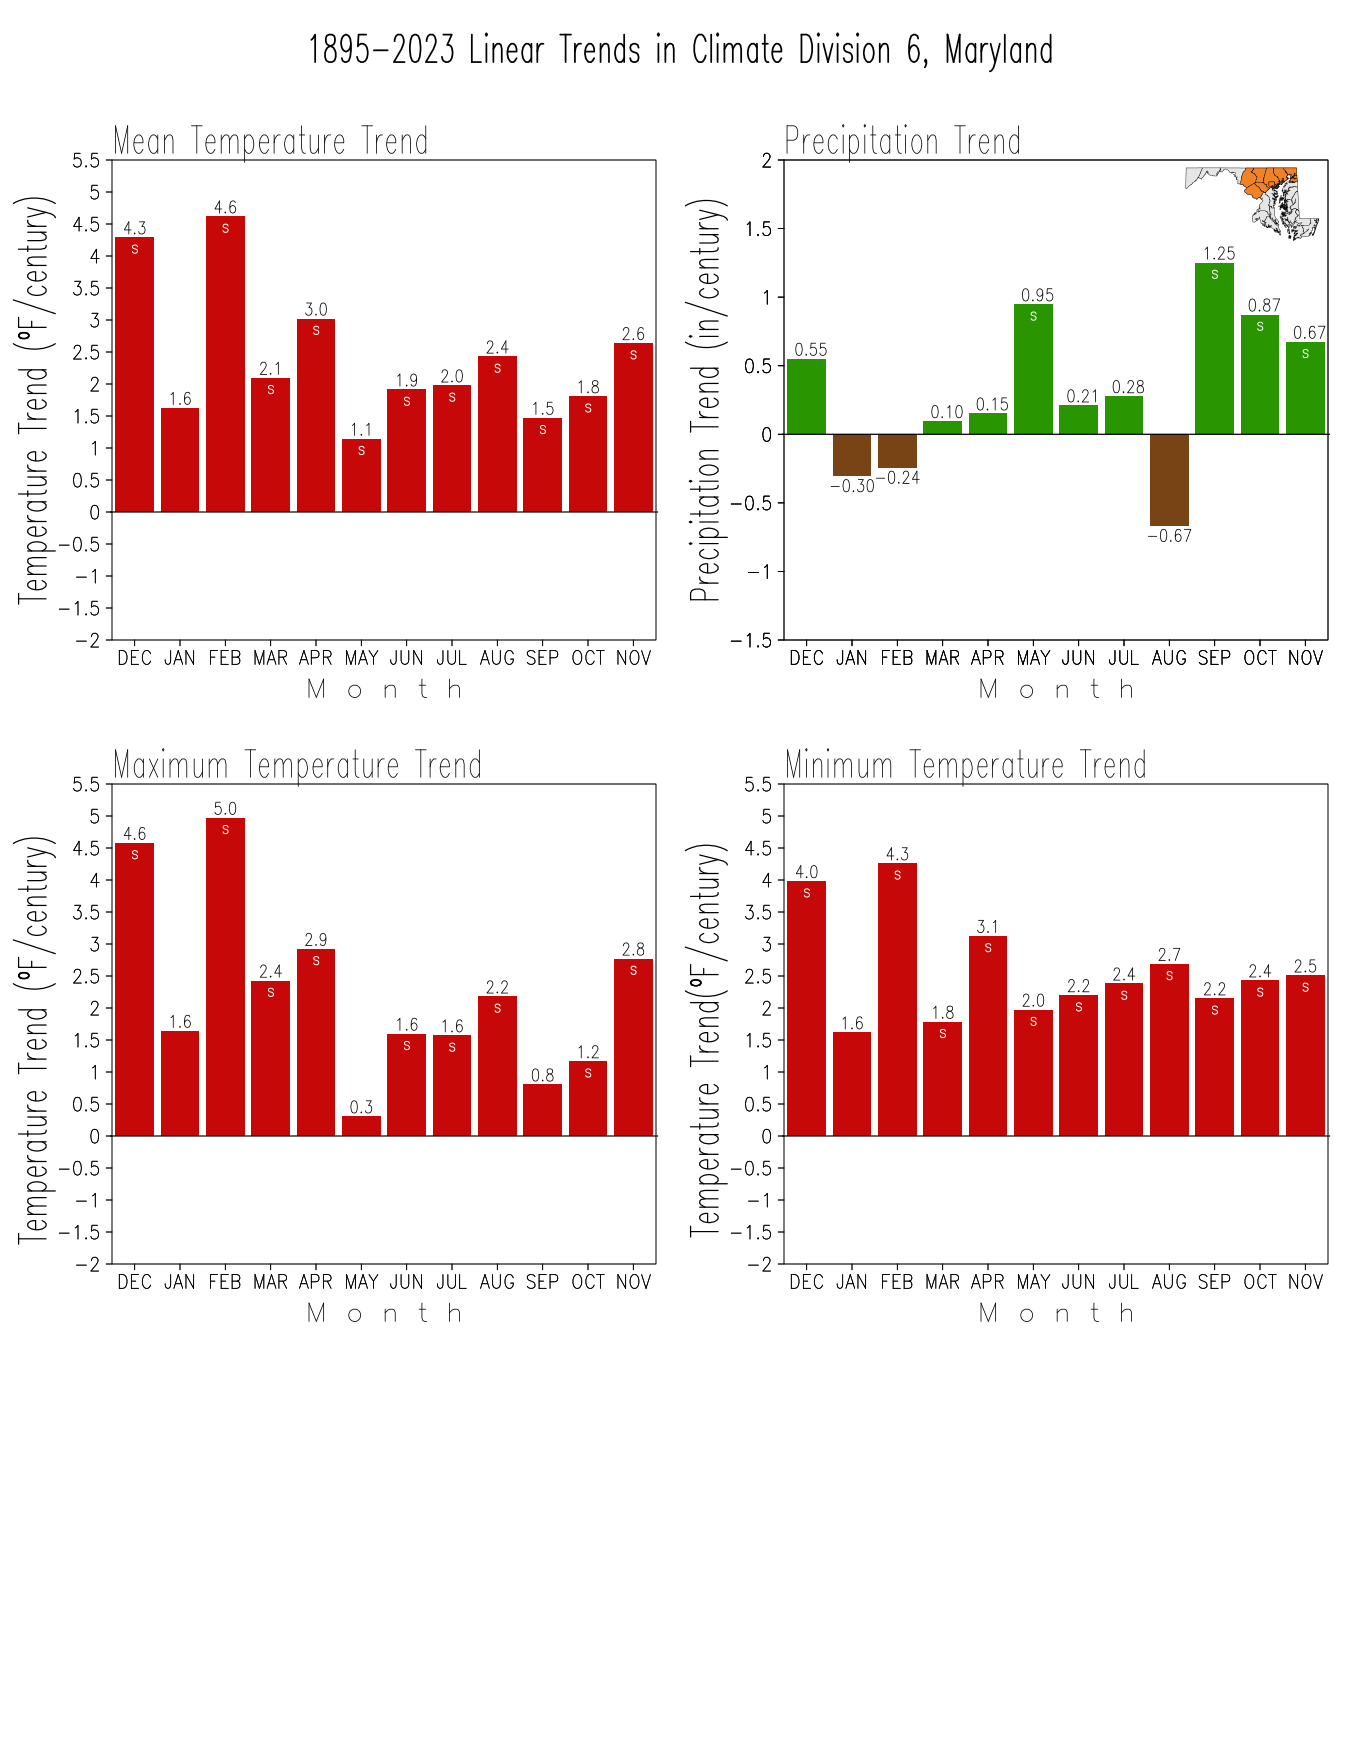
Note:The thick black continuos line shows the 1895-2023 linear trend, and the thick red continuos line shows the 2000-2023 linear trend. The thin black line marks the 1895-2023 mean, while the dashed grey lines show the standard deviation (SD) above and below the mean. Trends that are statistically significant at the 95% level (Student’s t-test −Santer et al. 2000) are labeled with a black "s" in the time series and a white "s" in the bar graphs; no significat trends in the time series are labeled with a black "ns" while those in the bar graphs are not labeled.
References