Climate Division 7 (Appalachian Mountains), Maryland
1895-2023
The following figures display the historical data for Climate Division 7 (Appalachian Mountains), Maryland from 1985 to 2023. The figures display time series of area-averaged surface air mean, maximum, minimum temperatures and total precipitation over the climate division at annual, seasonal and monthly resolutions with supperposed linear trends for the whole period (1895 - 2023) and for the 21st century period (2000-2023). A summary figure of the monthly trends for the whole period is inlcuded at the bottom. Climate Division 7 includes the counties of Allegany and Washington.
The figures are created from NCEI's NClimDiv data set, v1.0.0. Data labeled as scaled on December 9, 2024.
Climate Division 7 Temperatures (°F) & Total Precipitation (in)
1895-2023
Annual
×
![]()
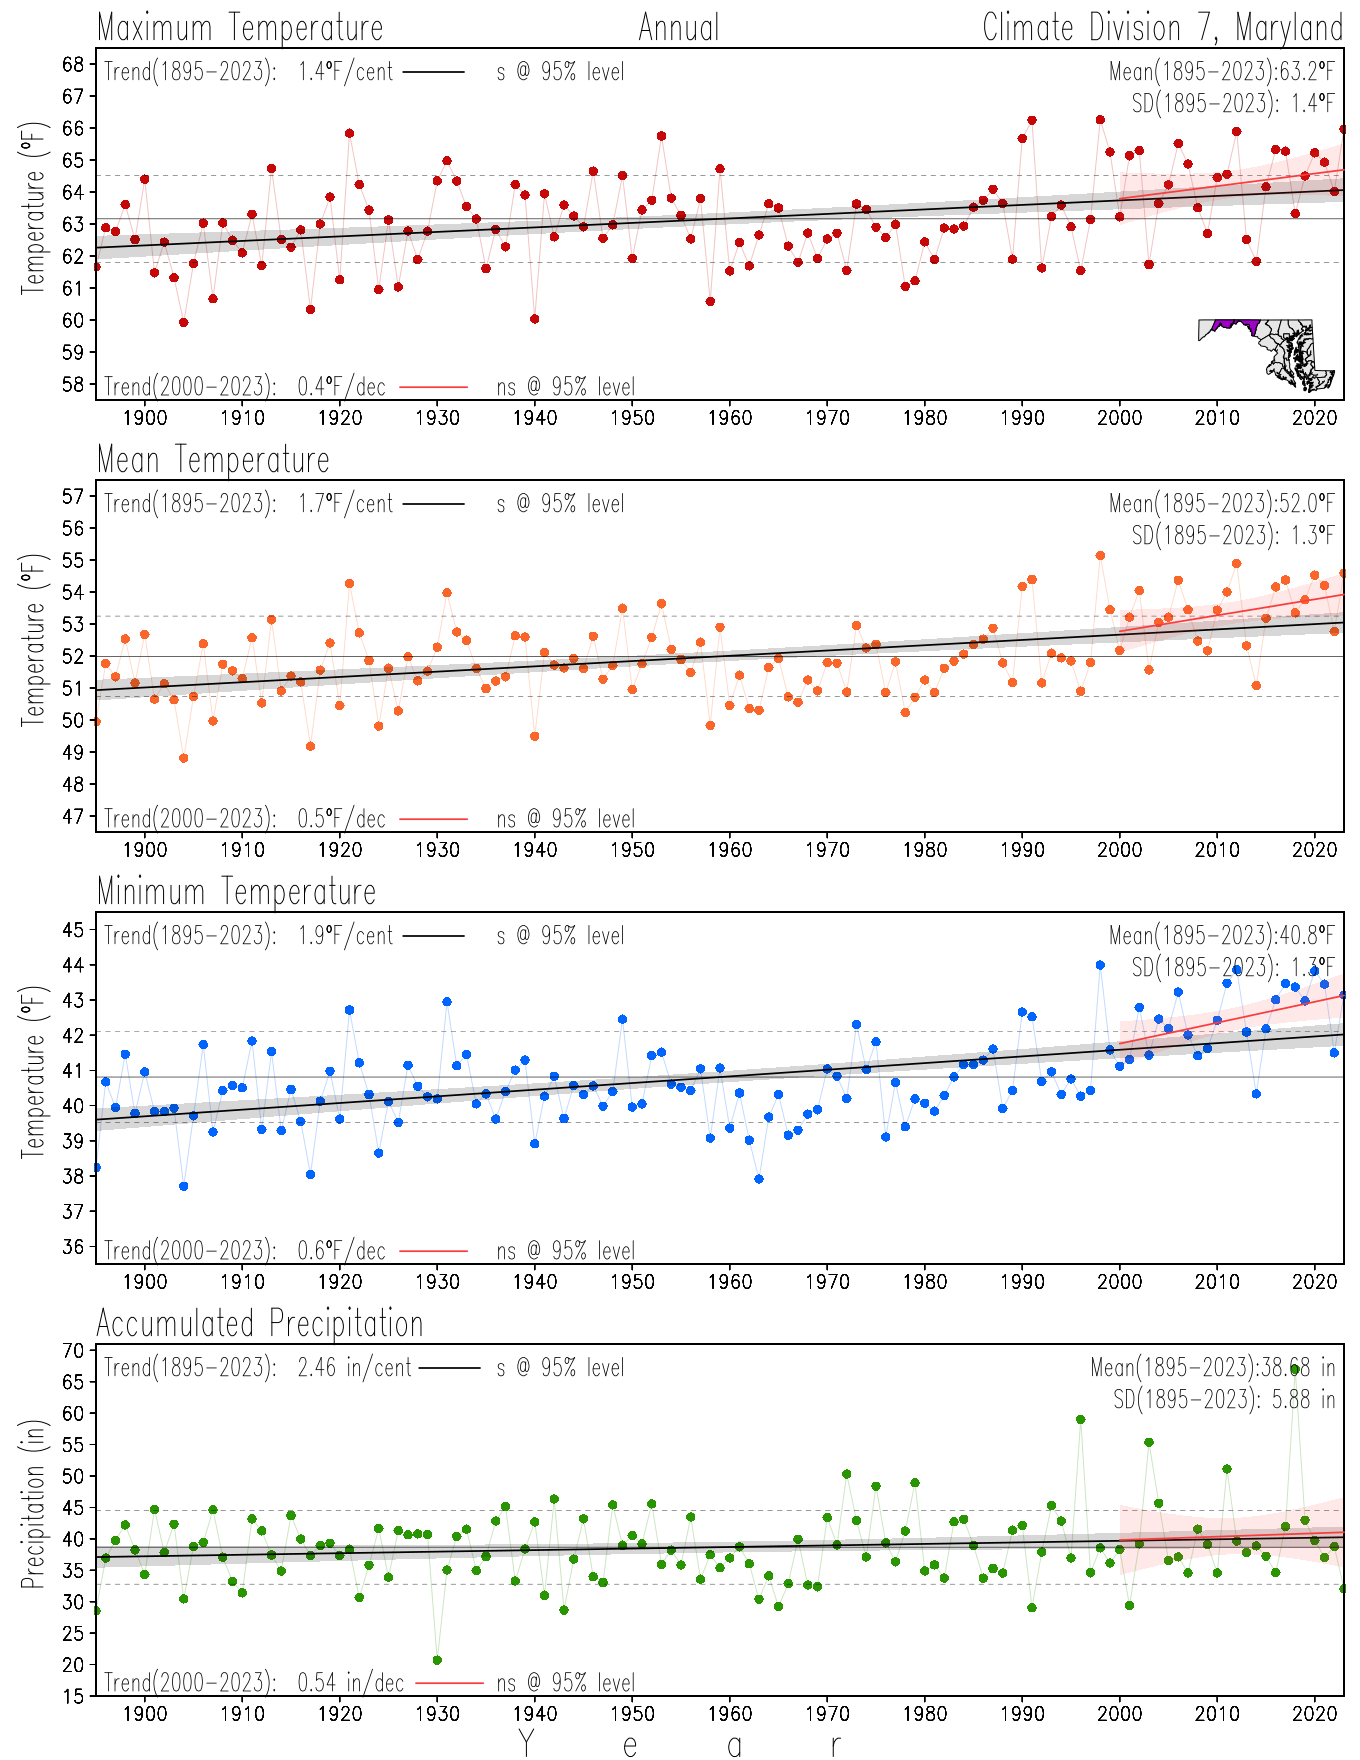
Annual
Seasonal
×
![]()
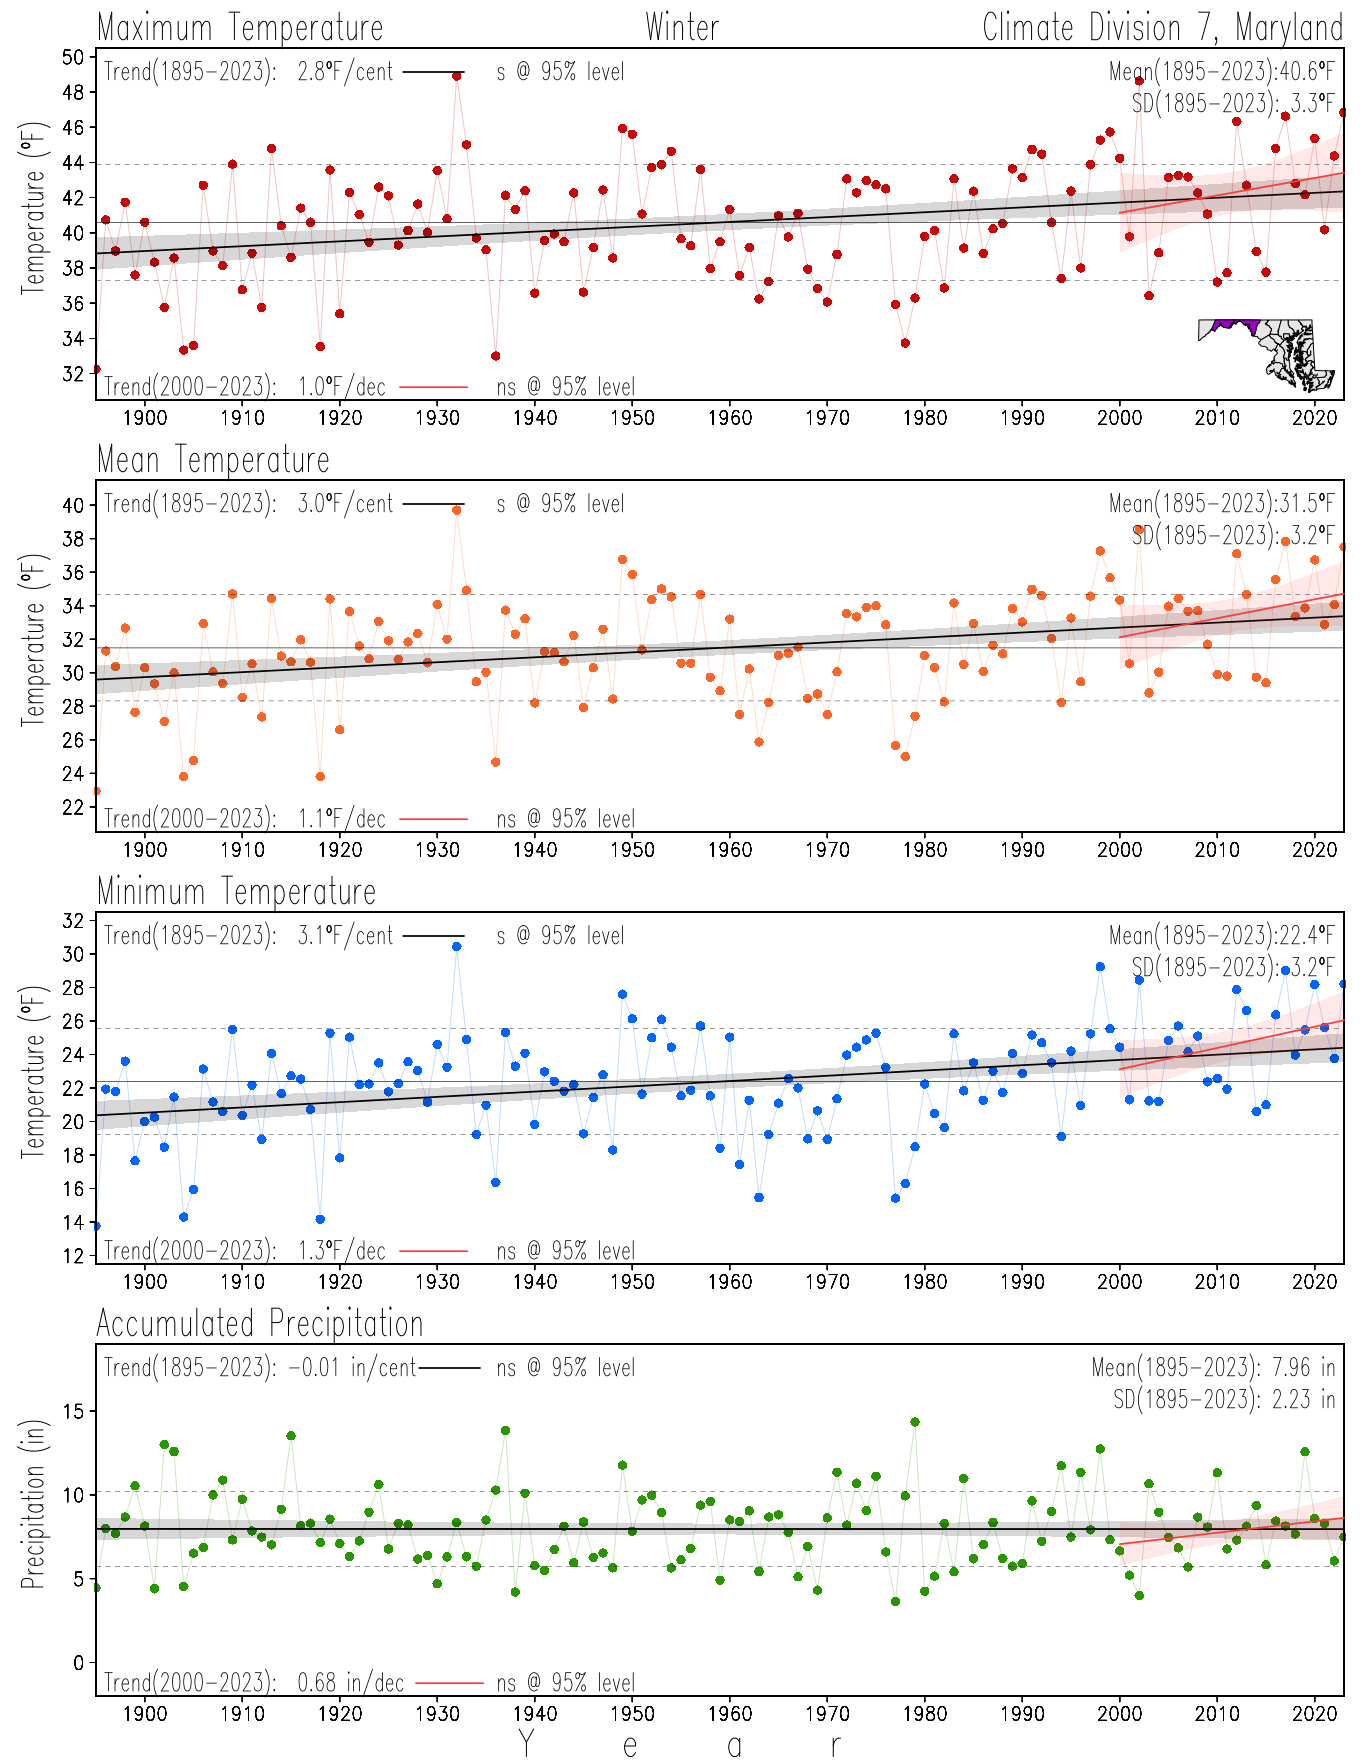
Winter
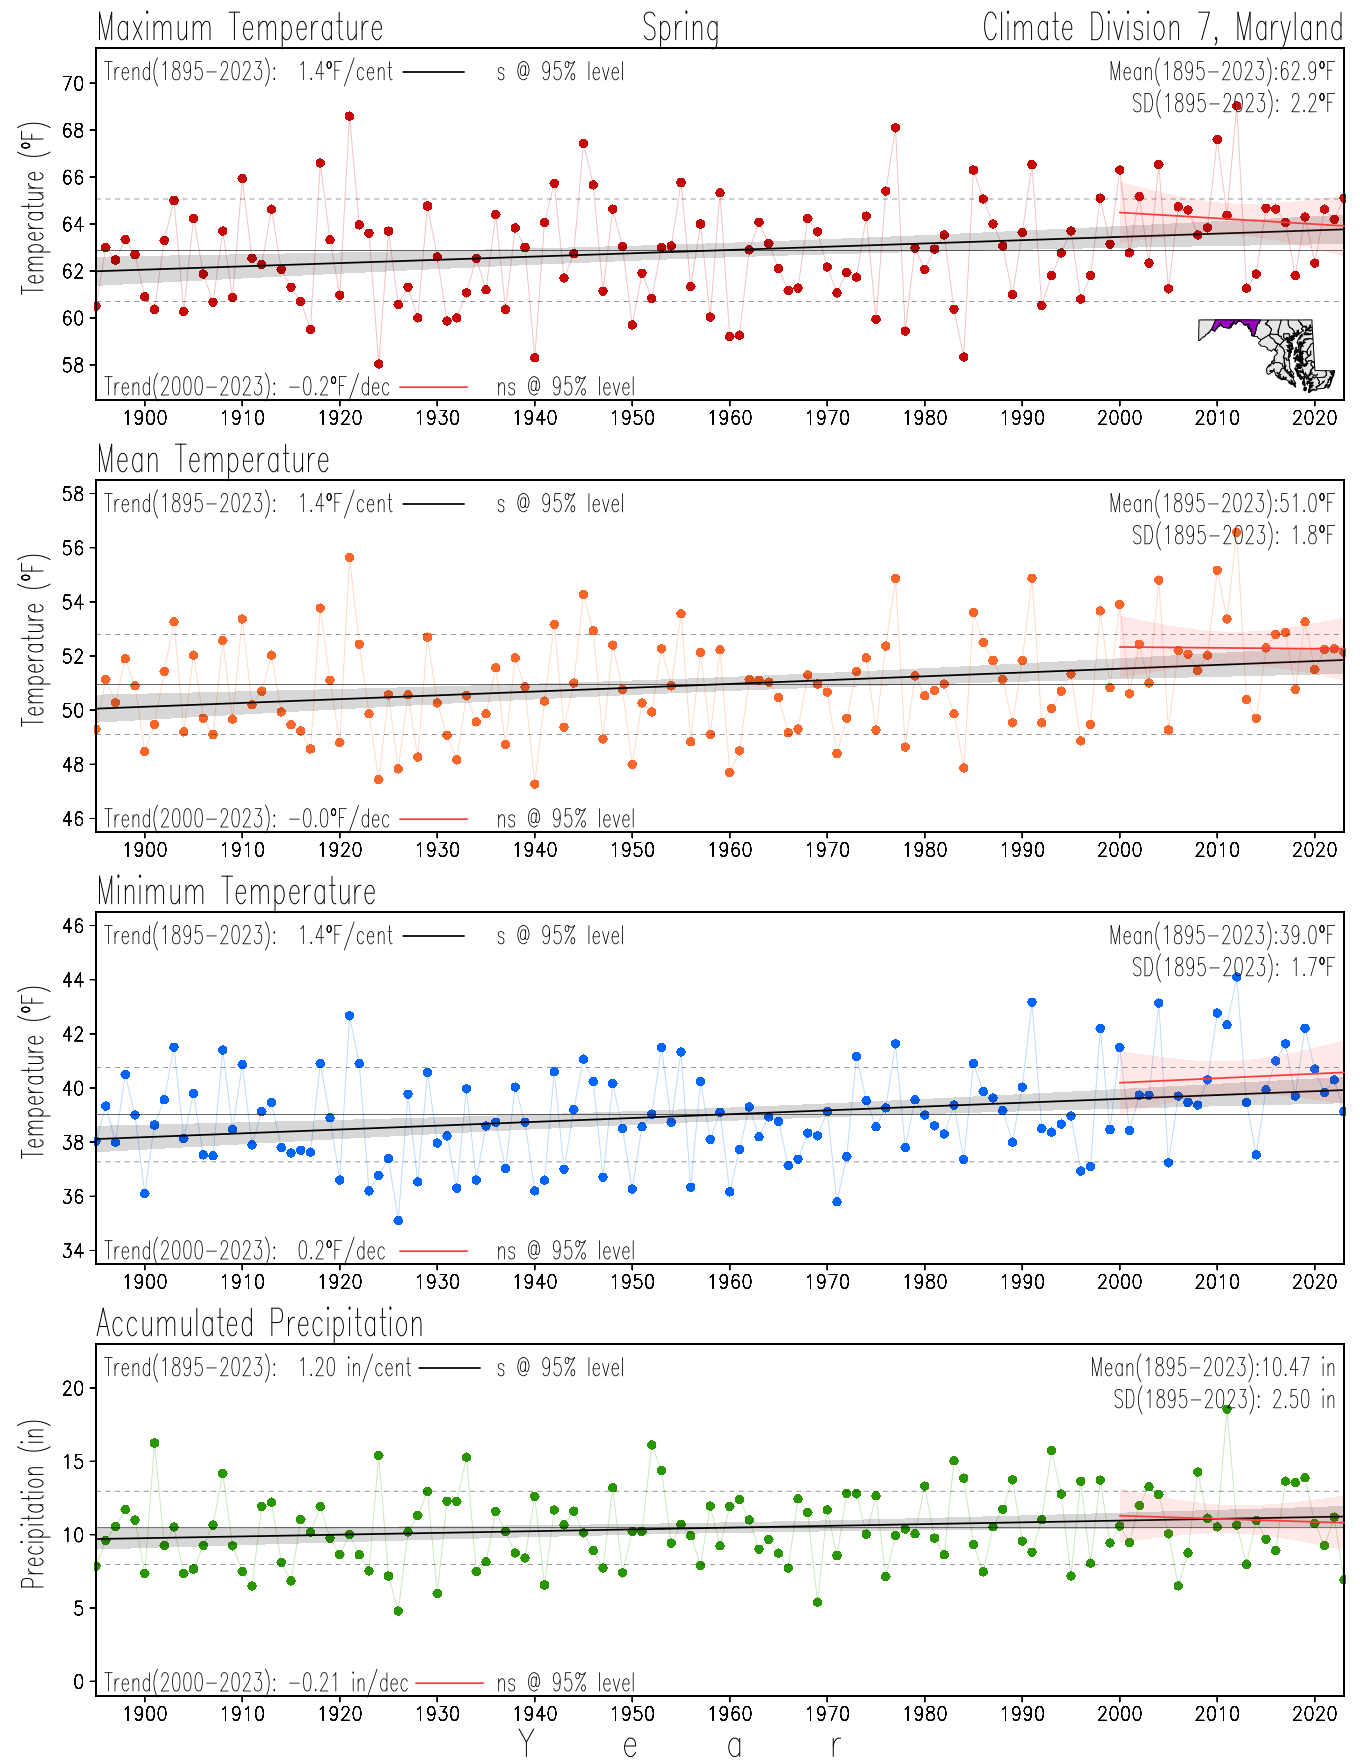
Spring
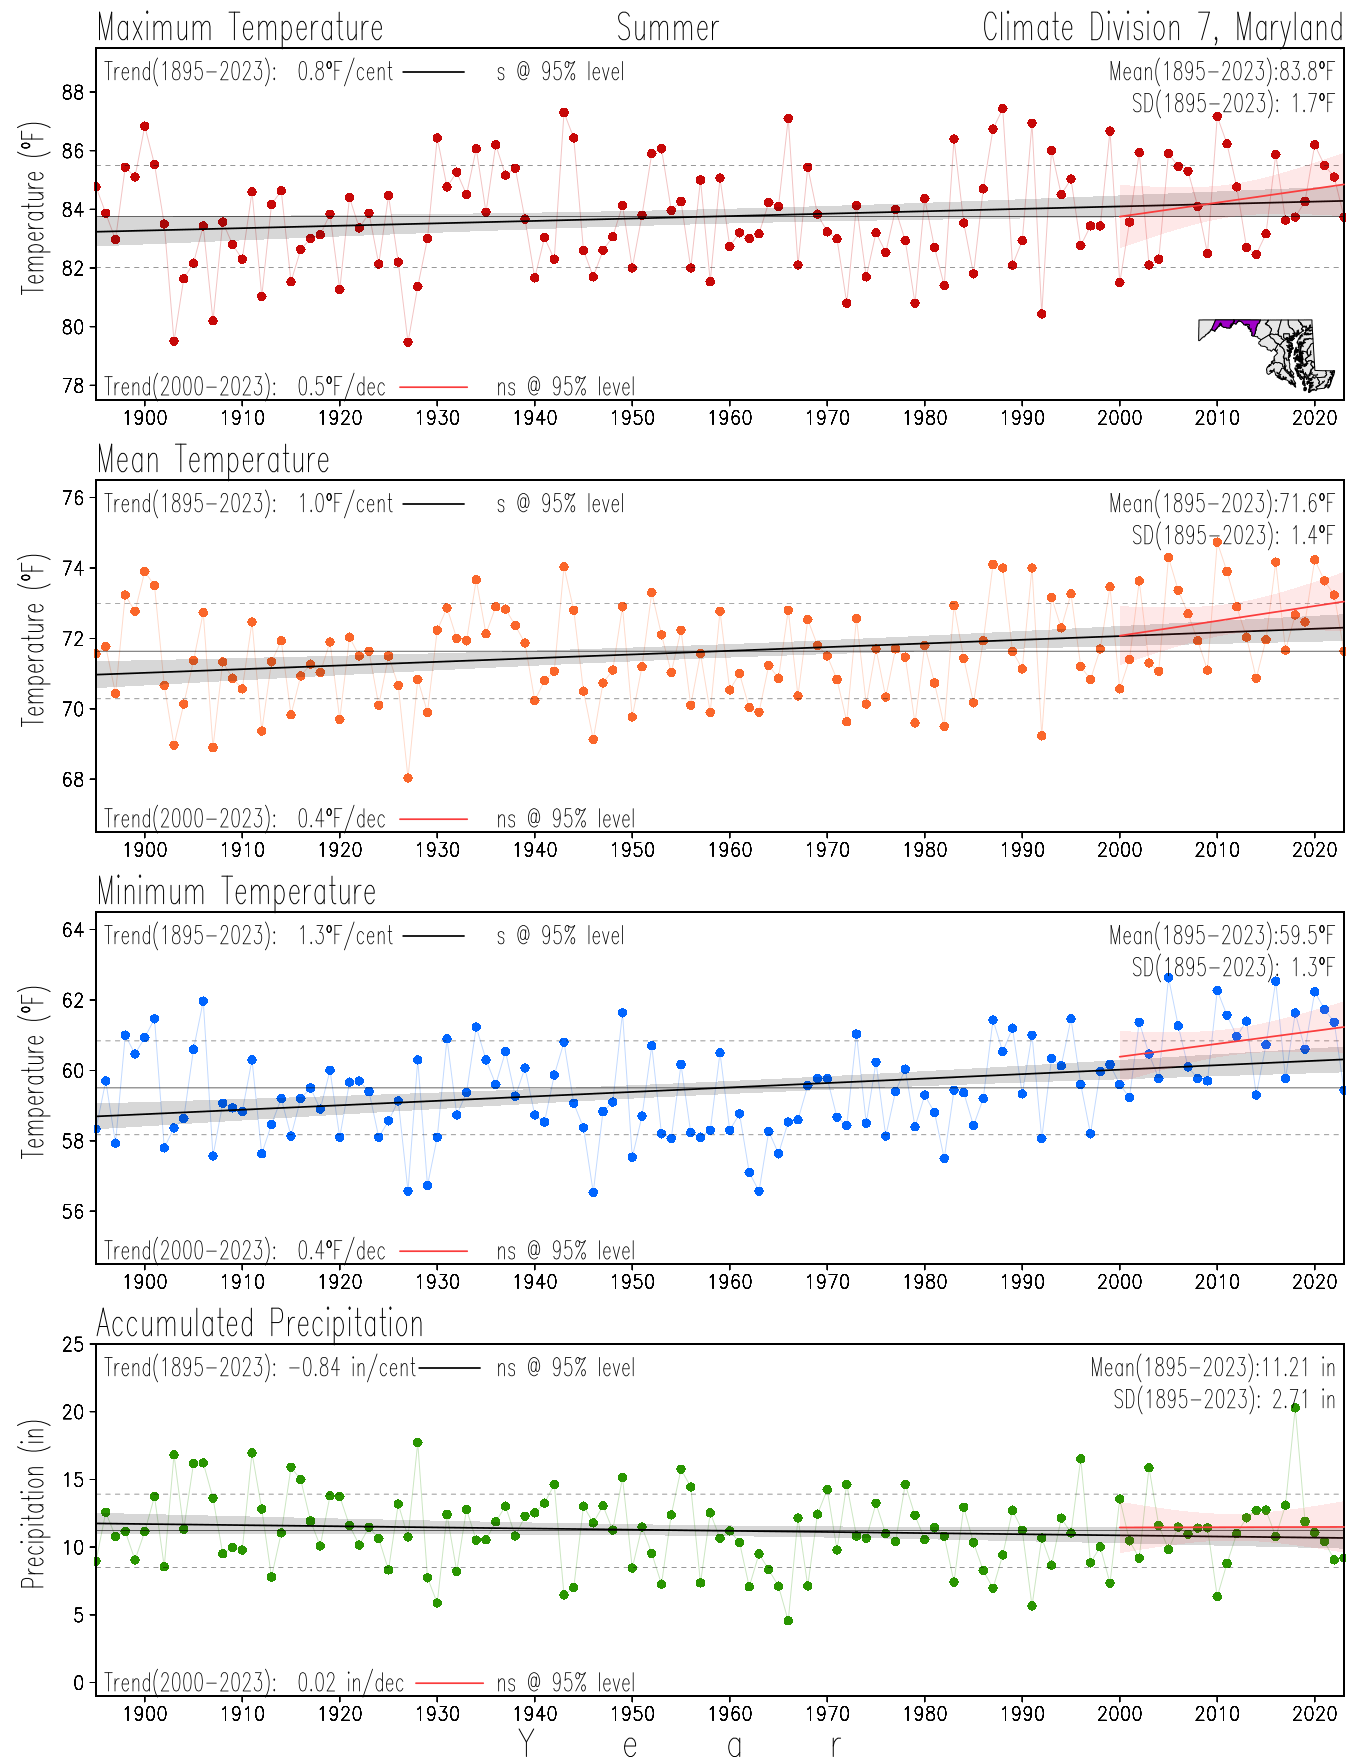
Summer
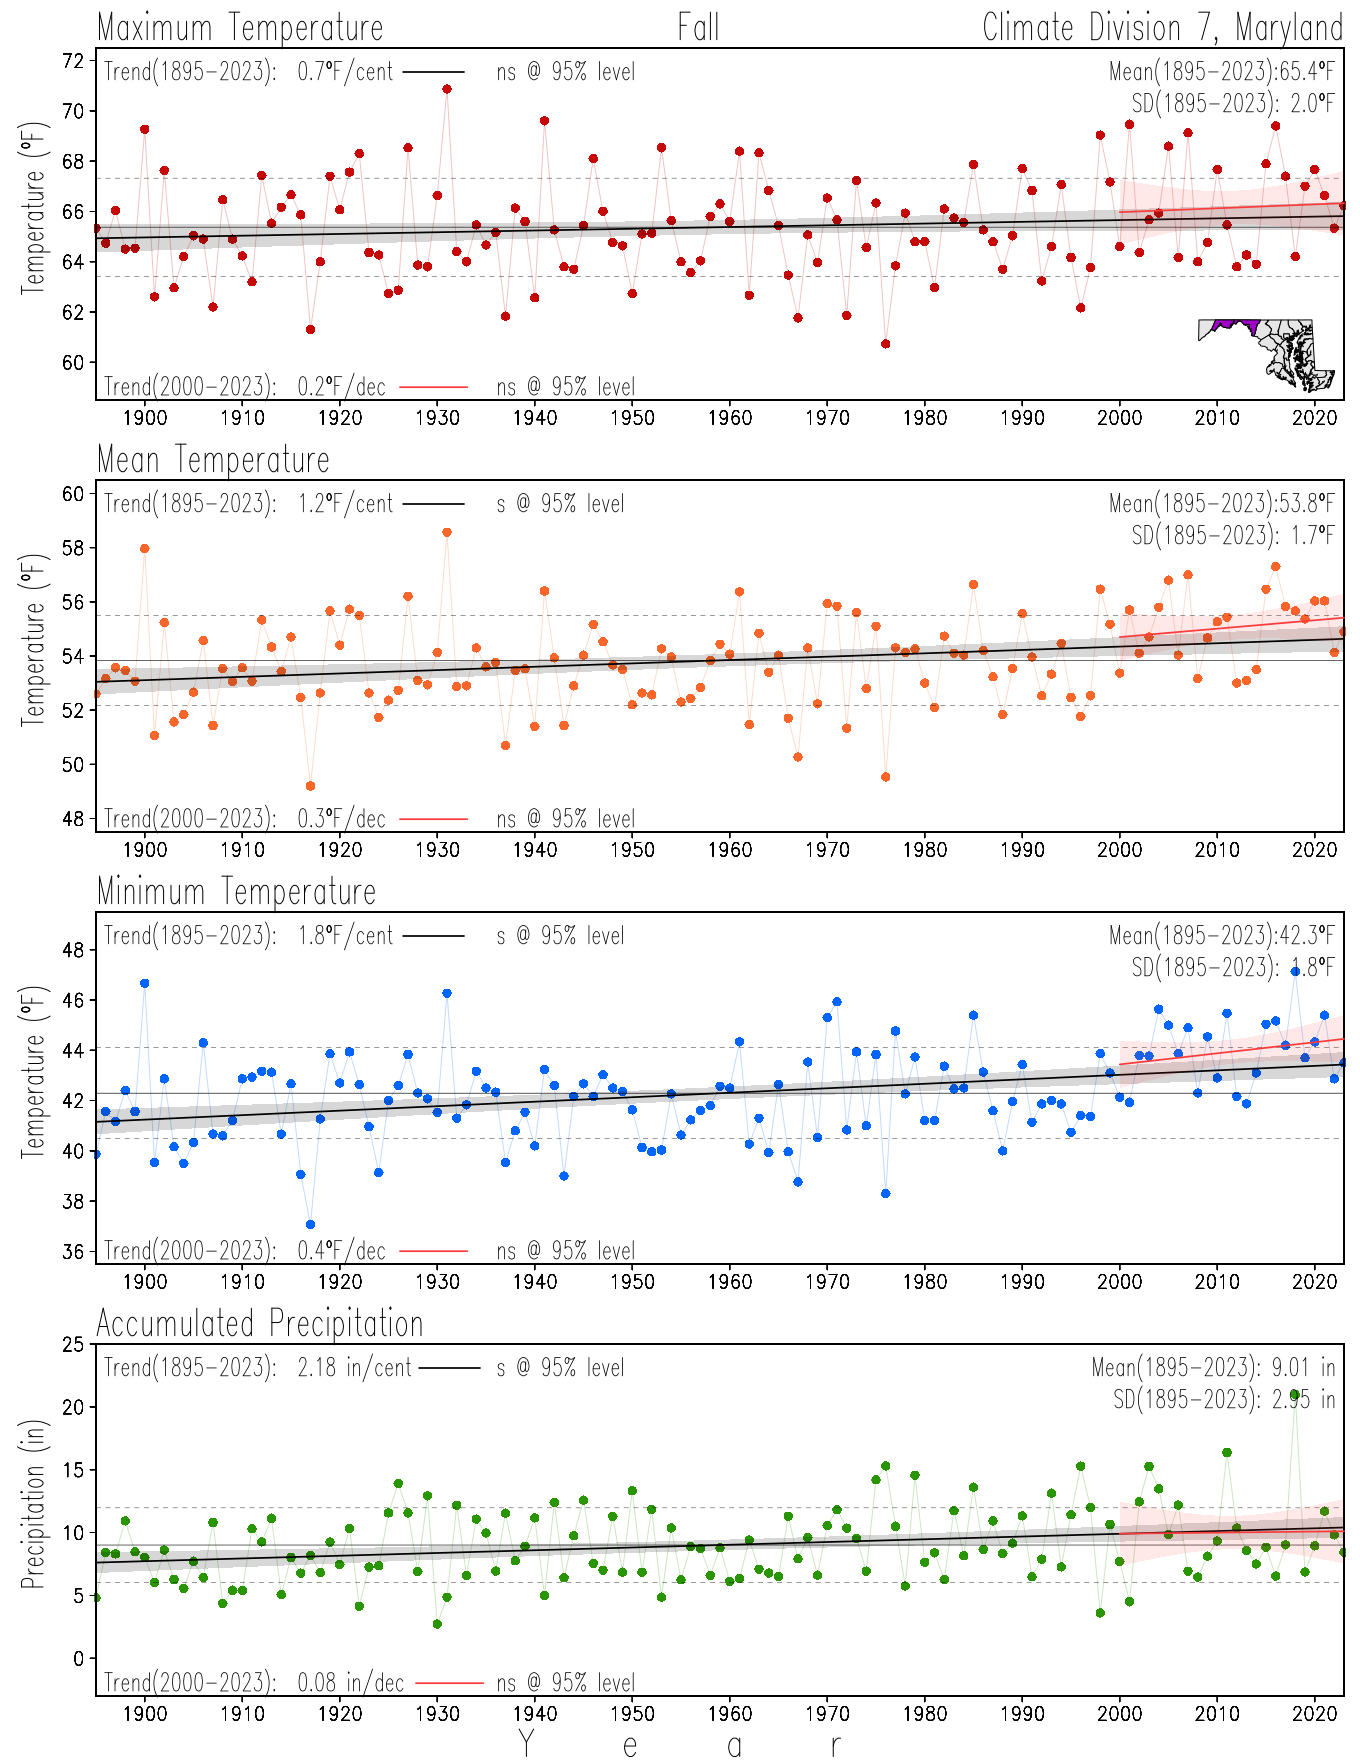
Fall
Monthly
×
![]()
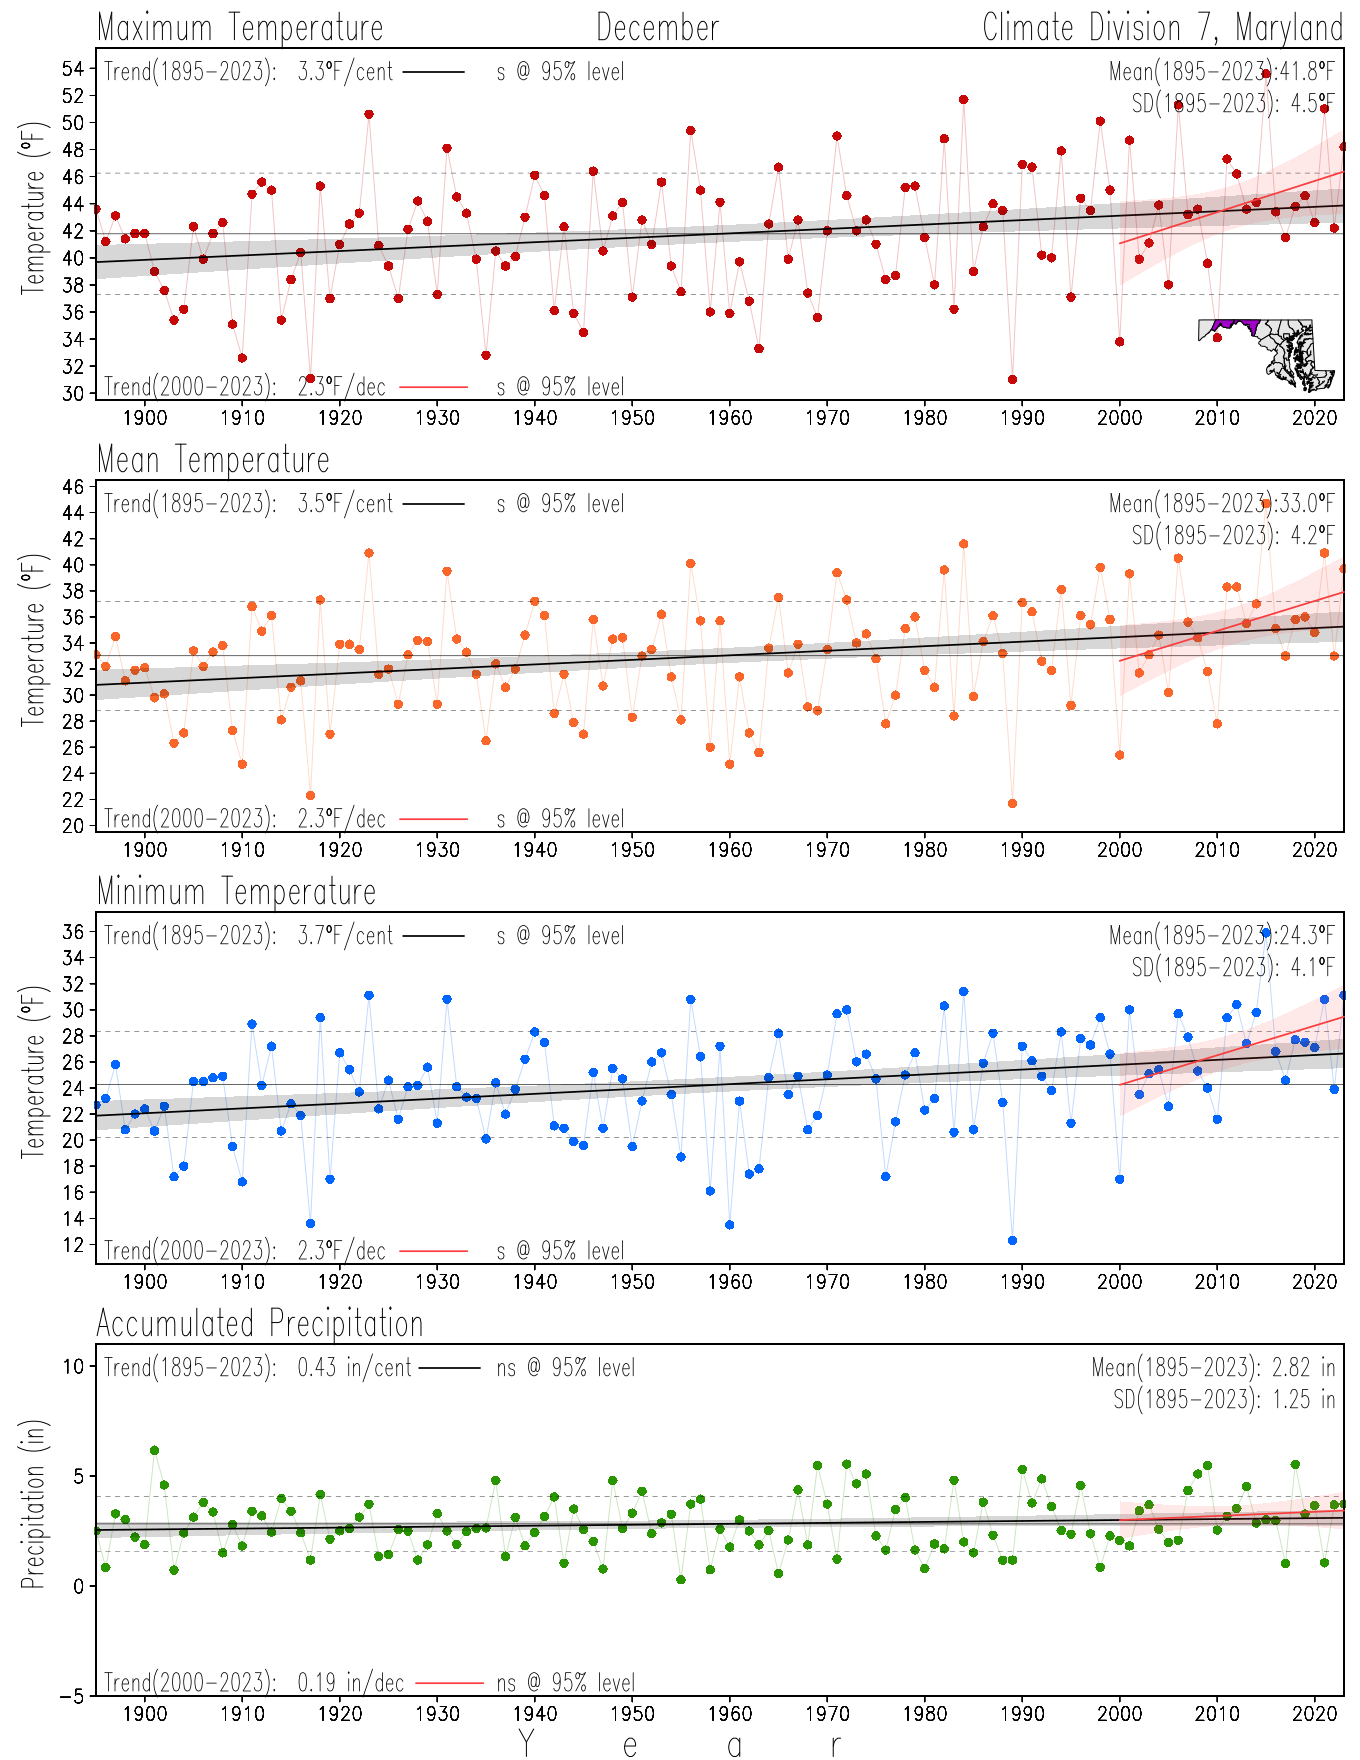
December
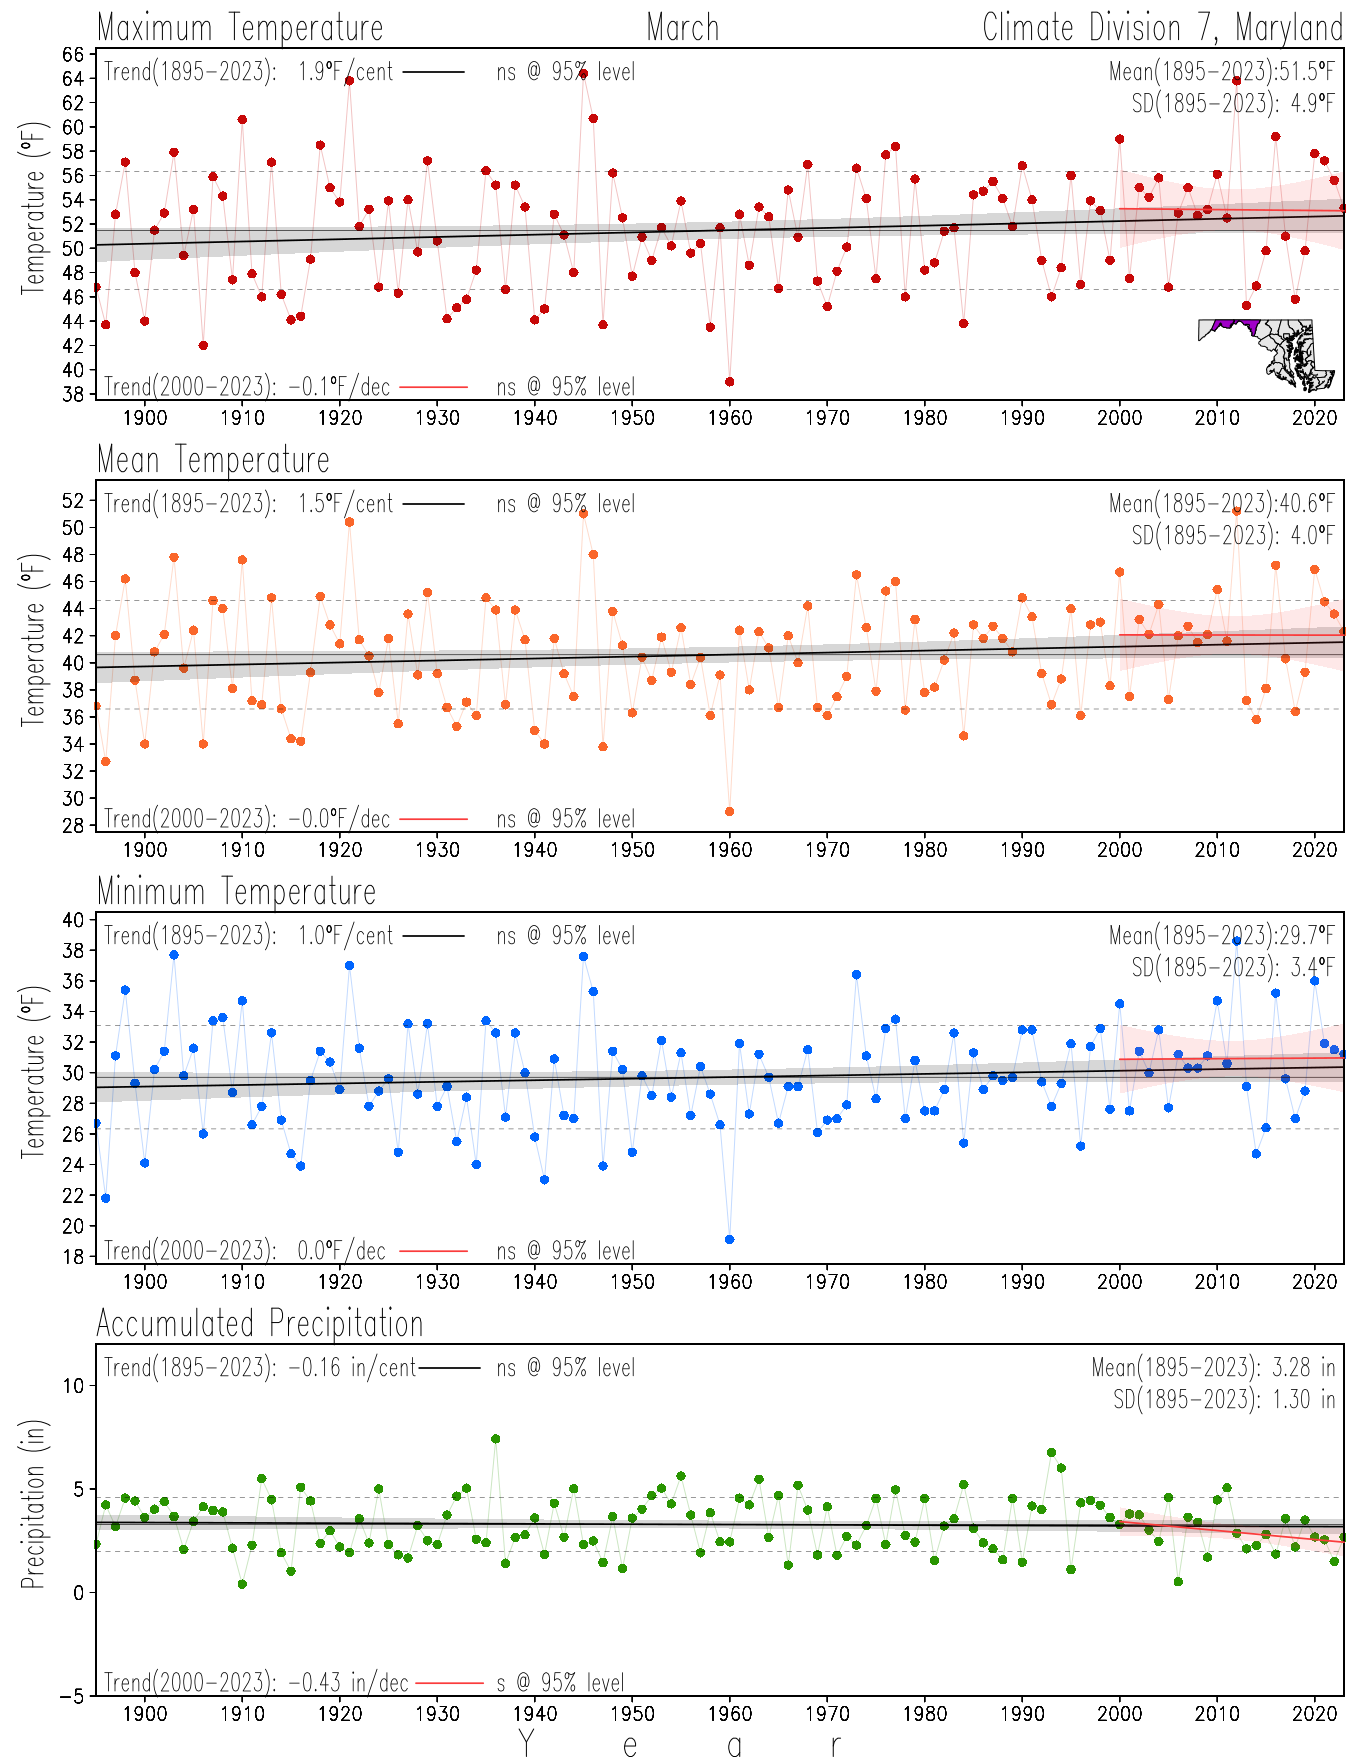
March
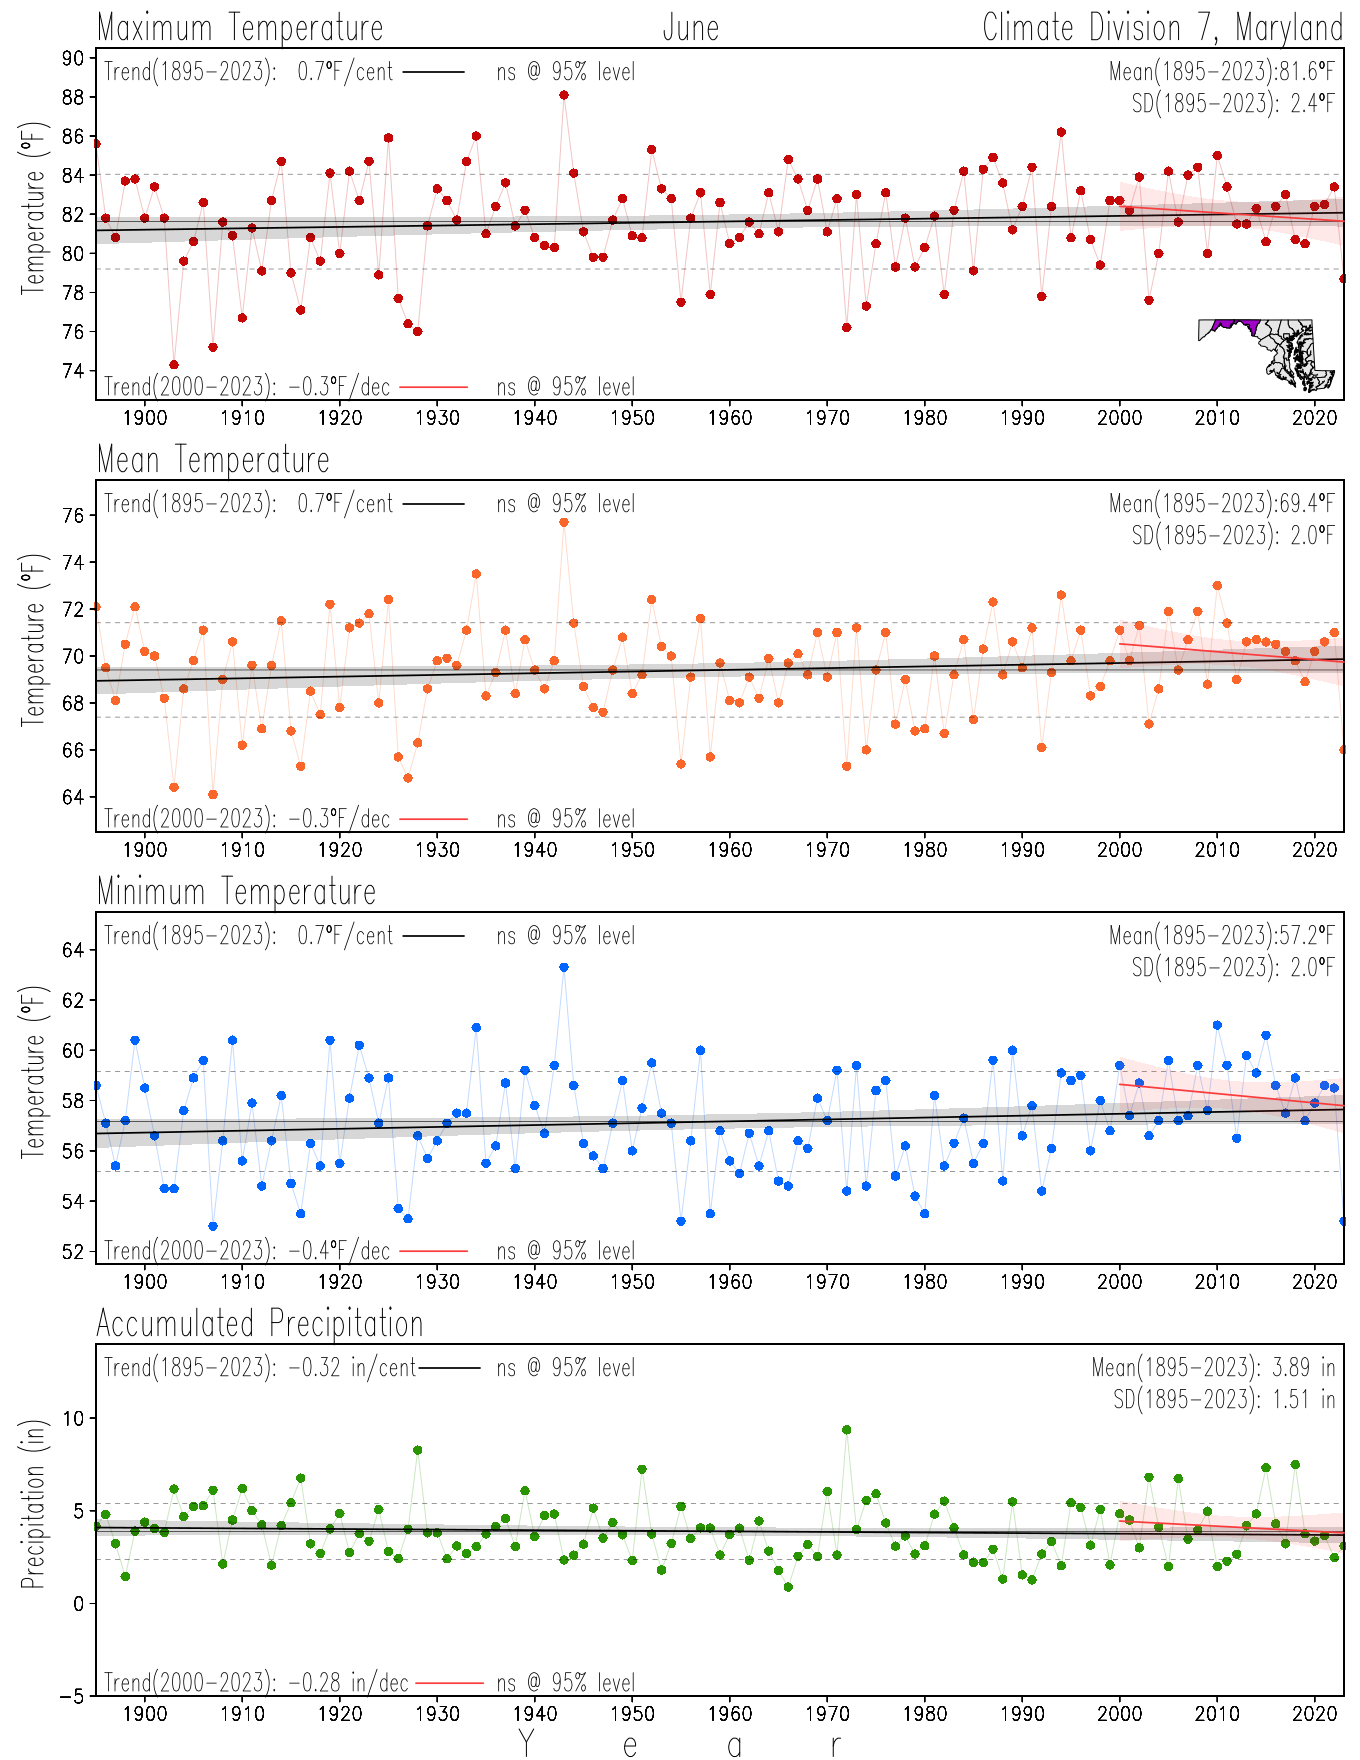
June
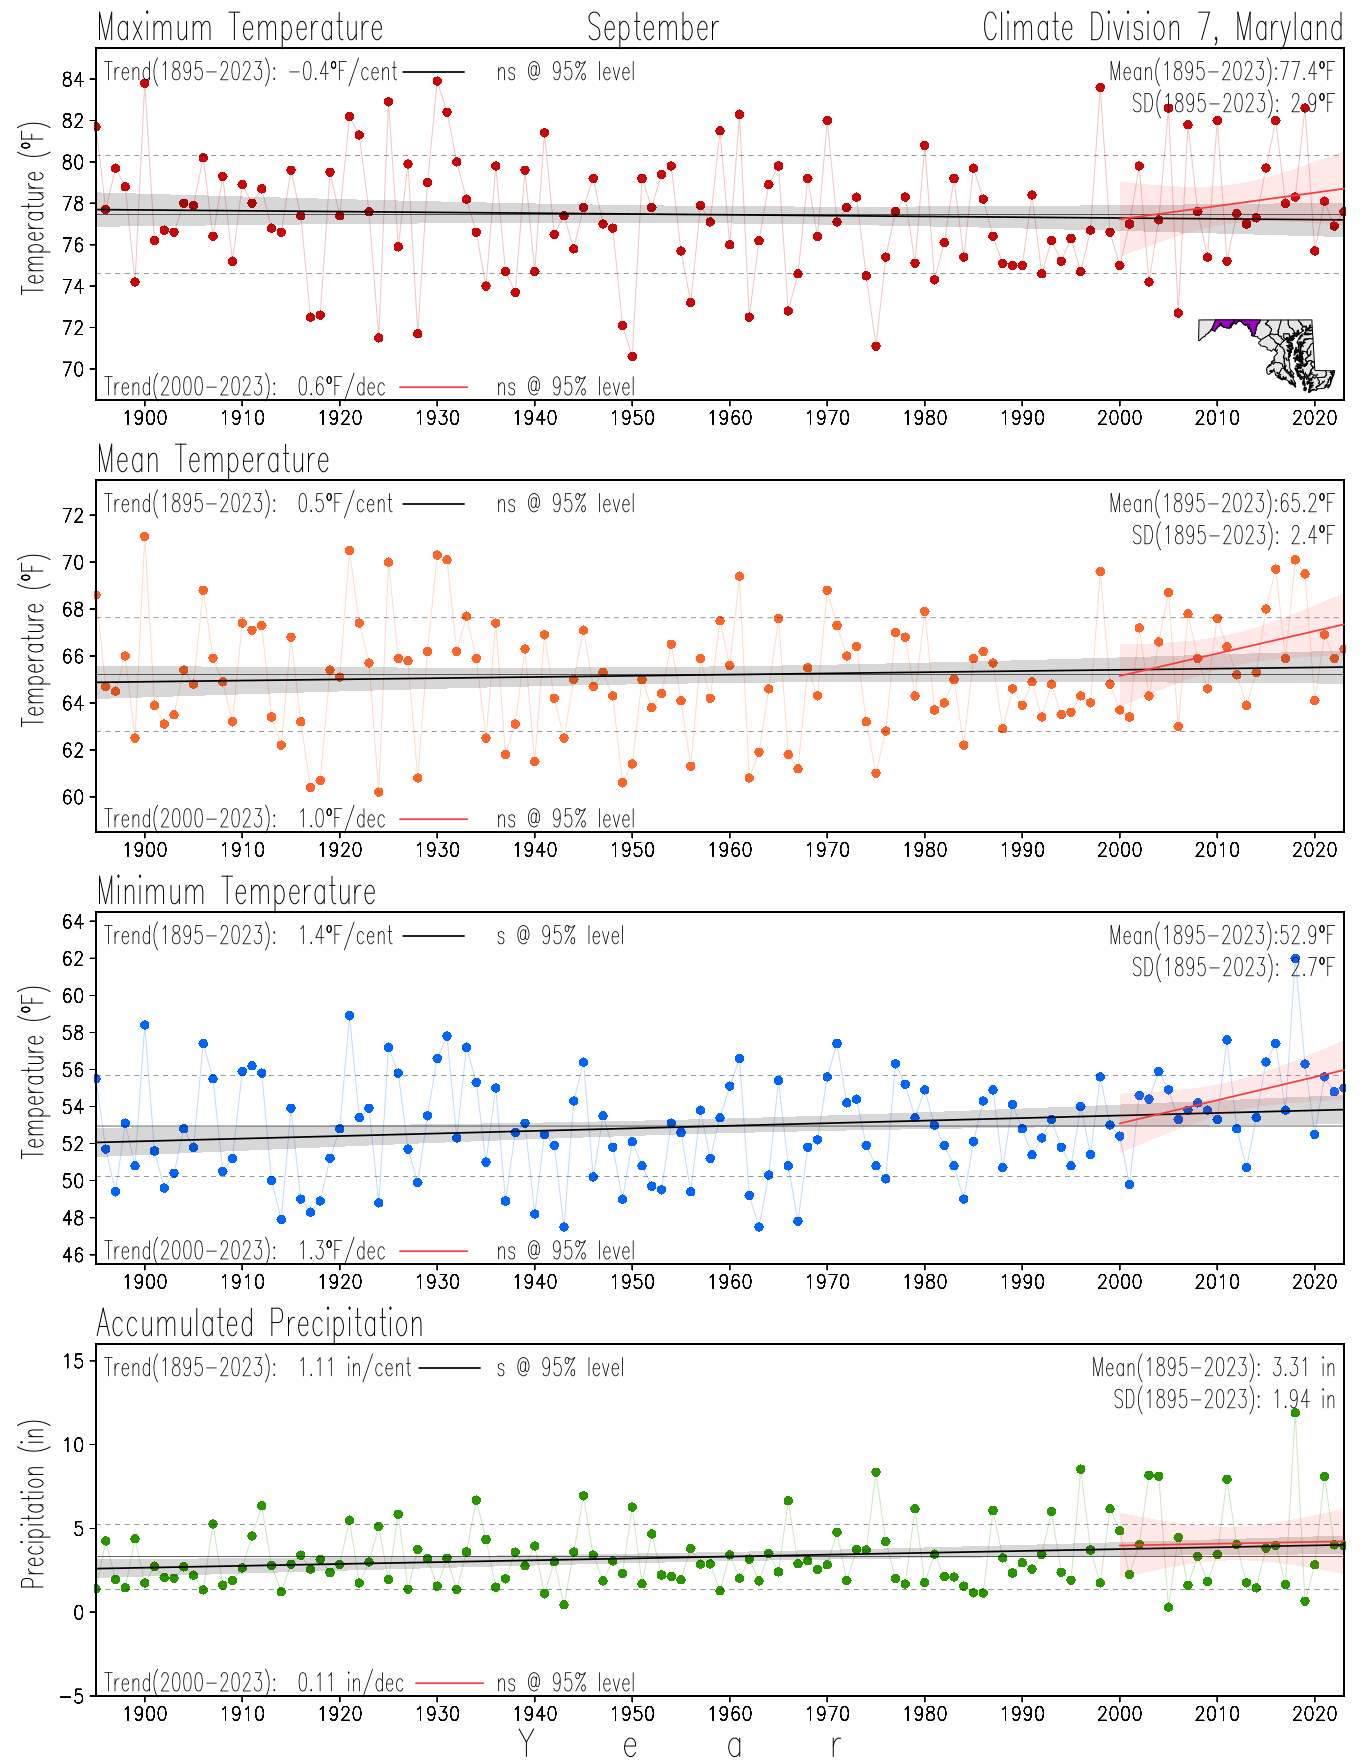
September
×
![]()
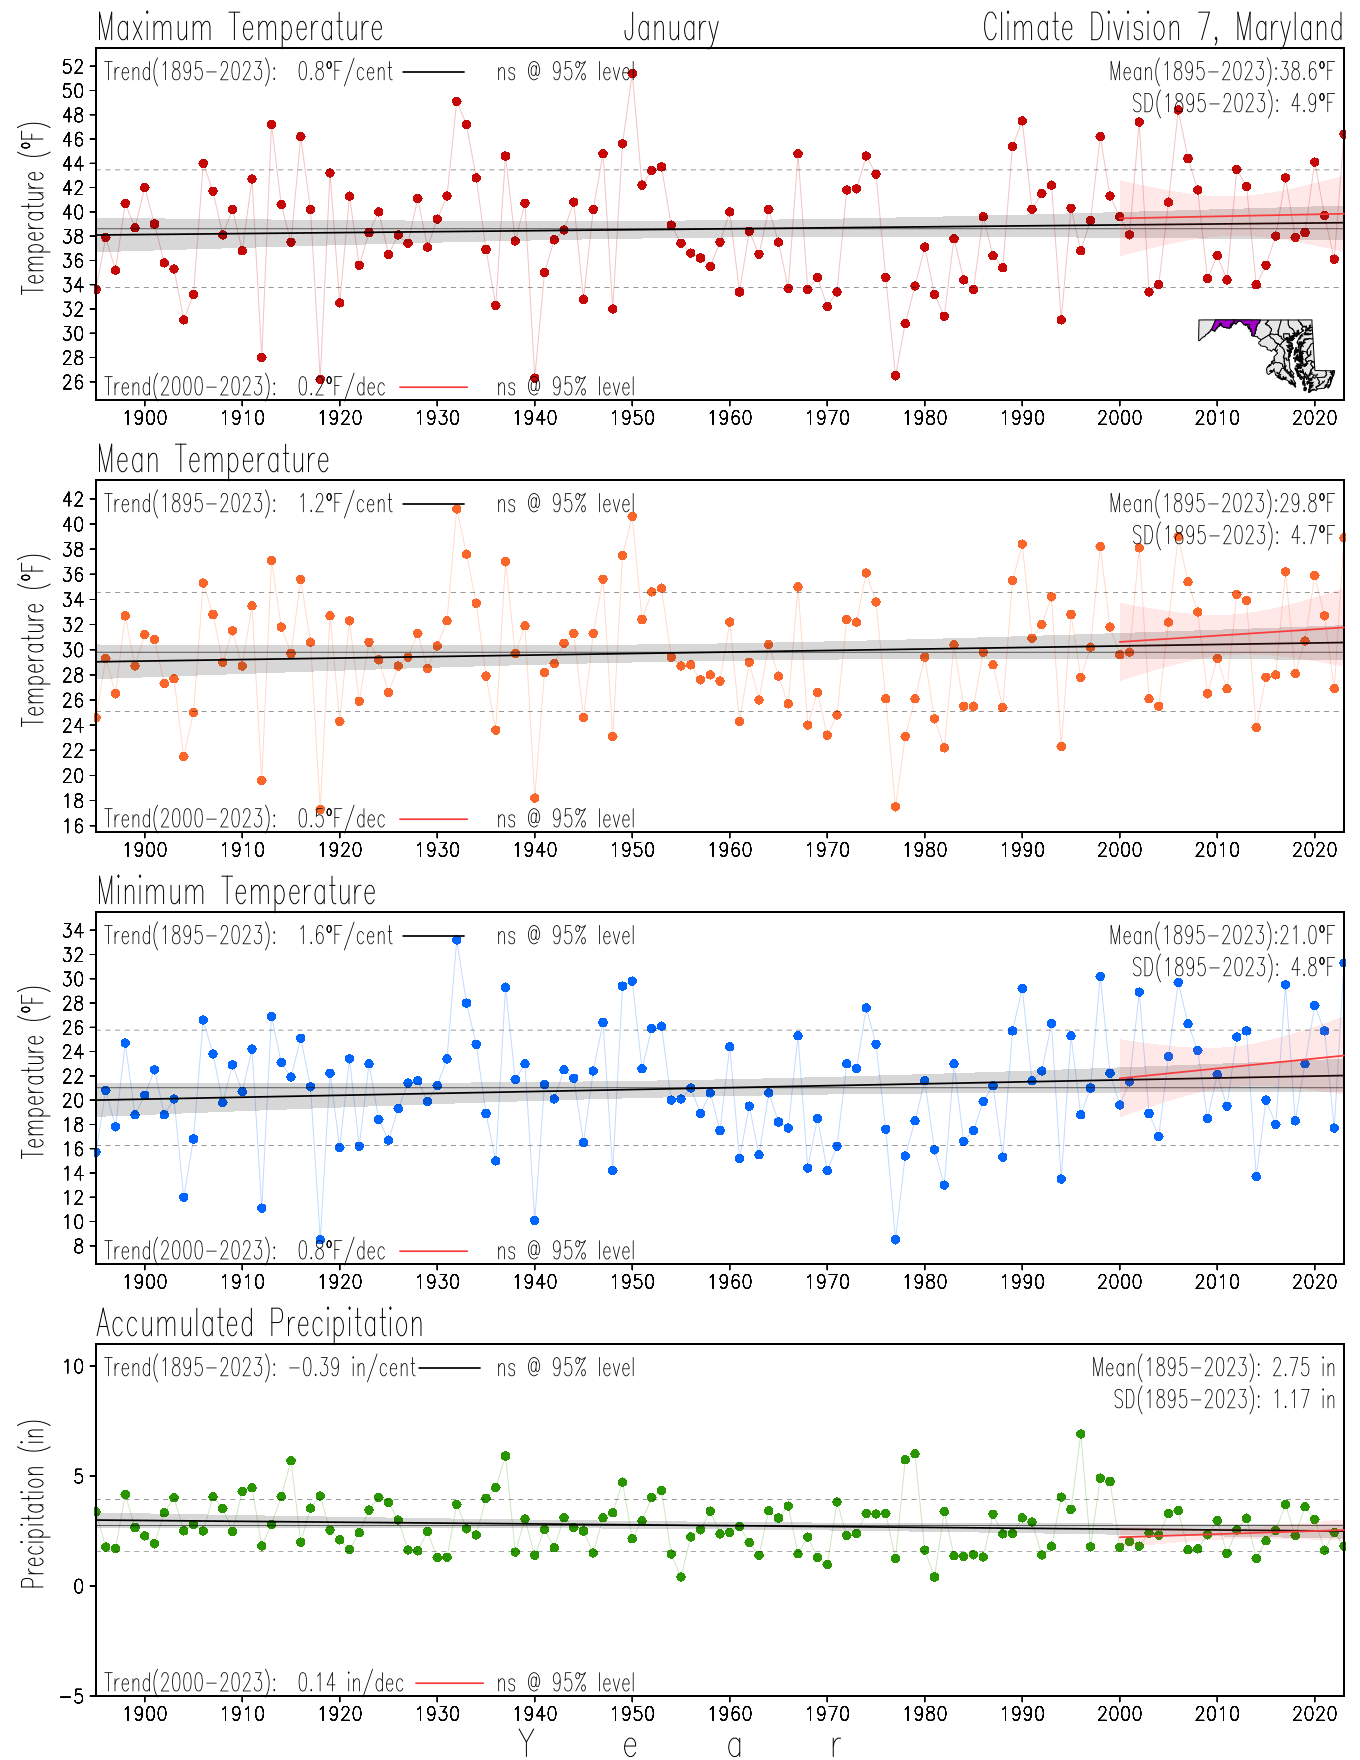
January
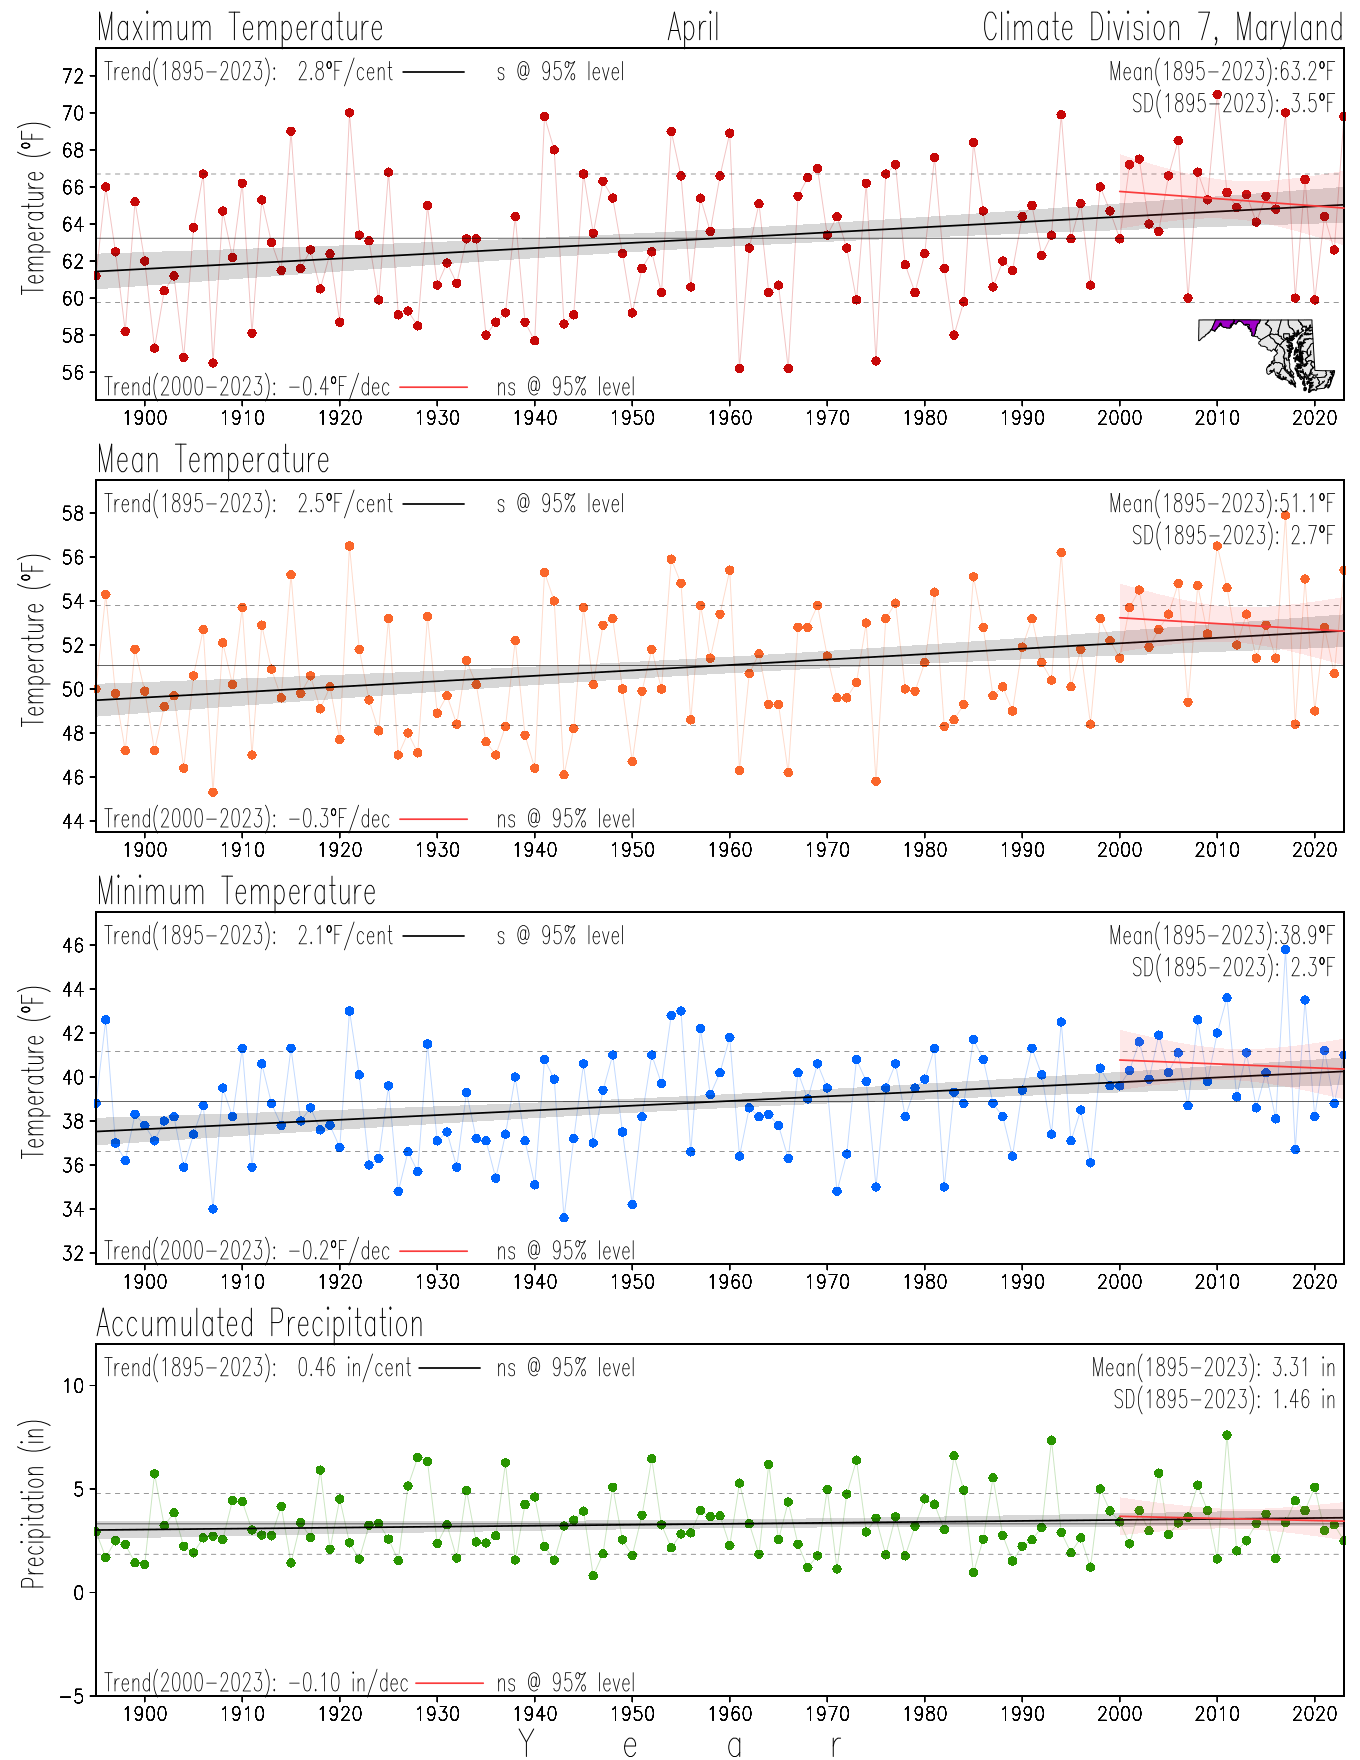
April
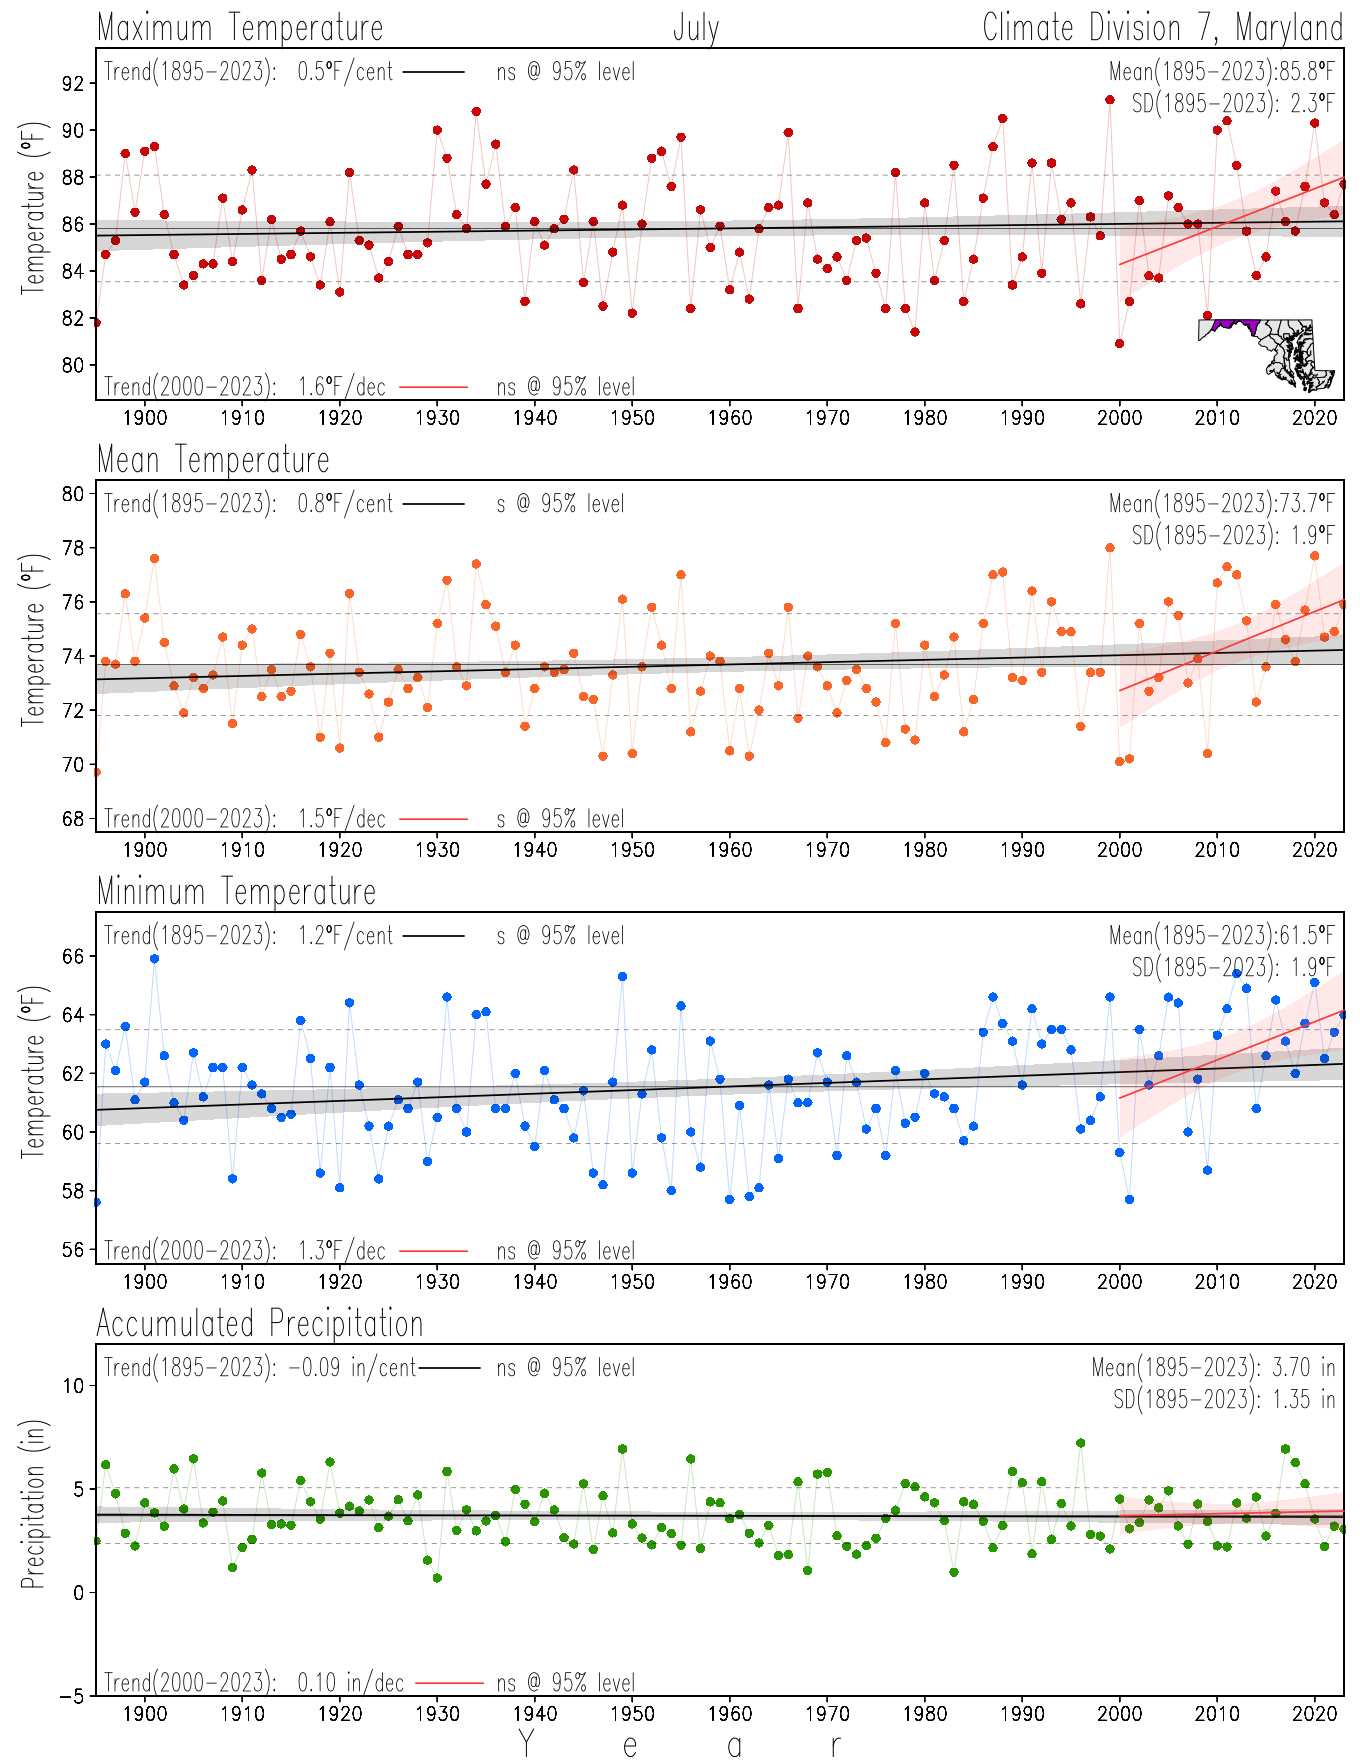
July
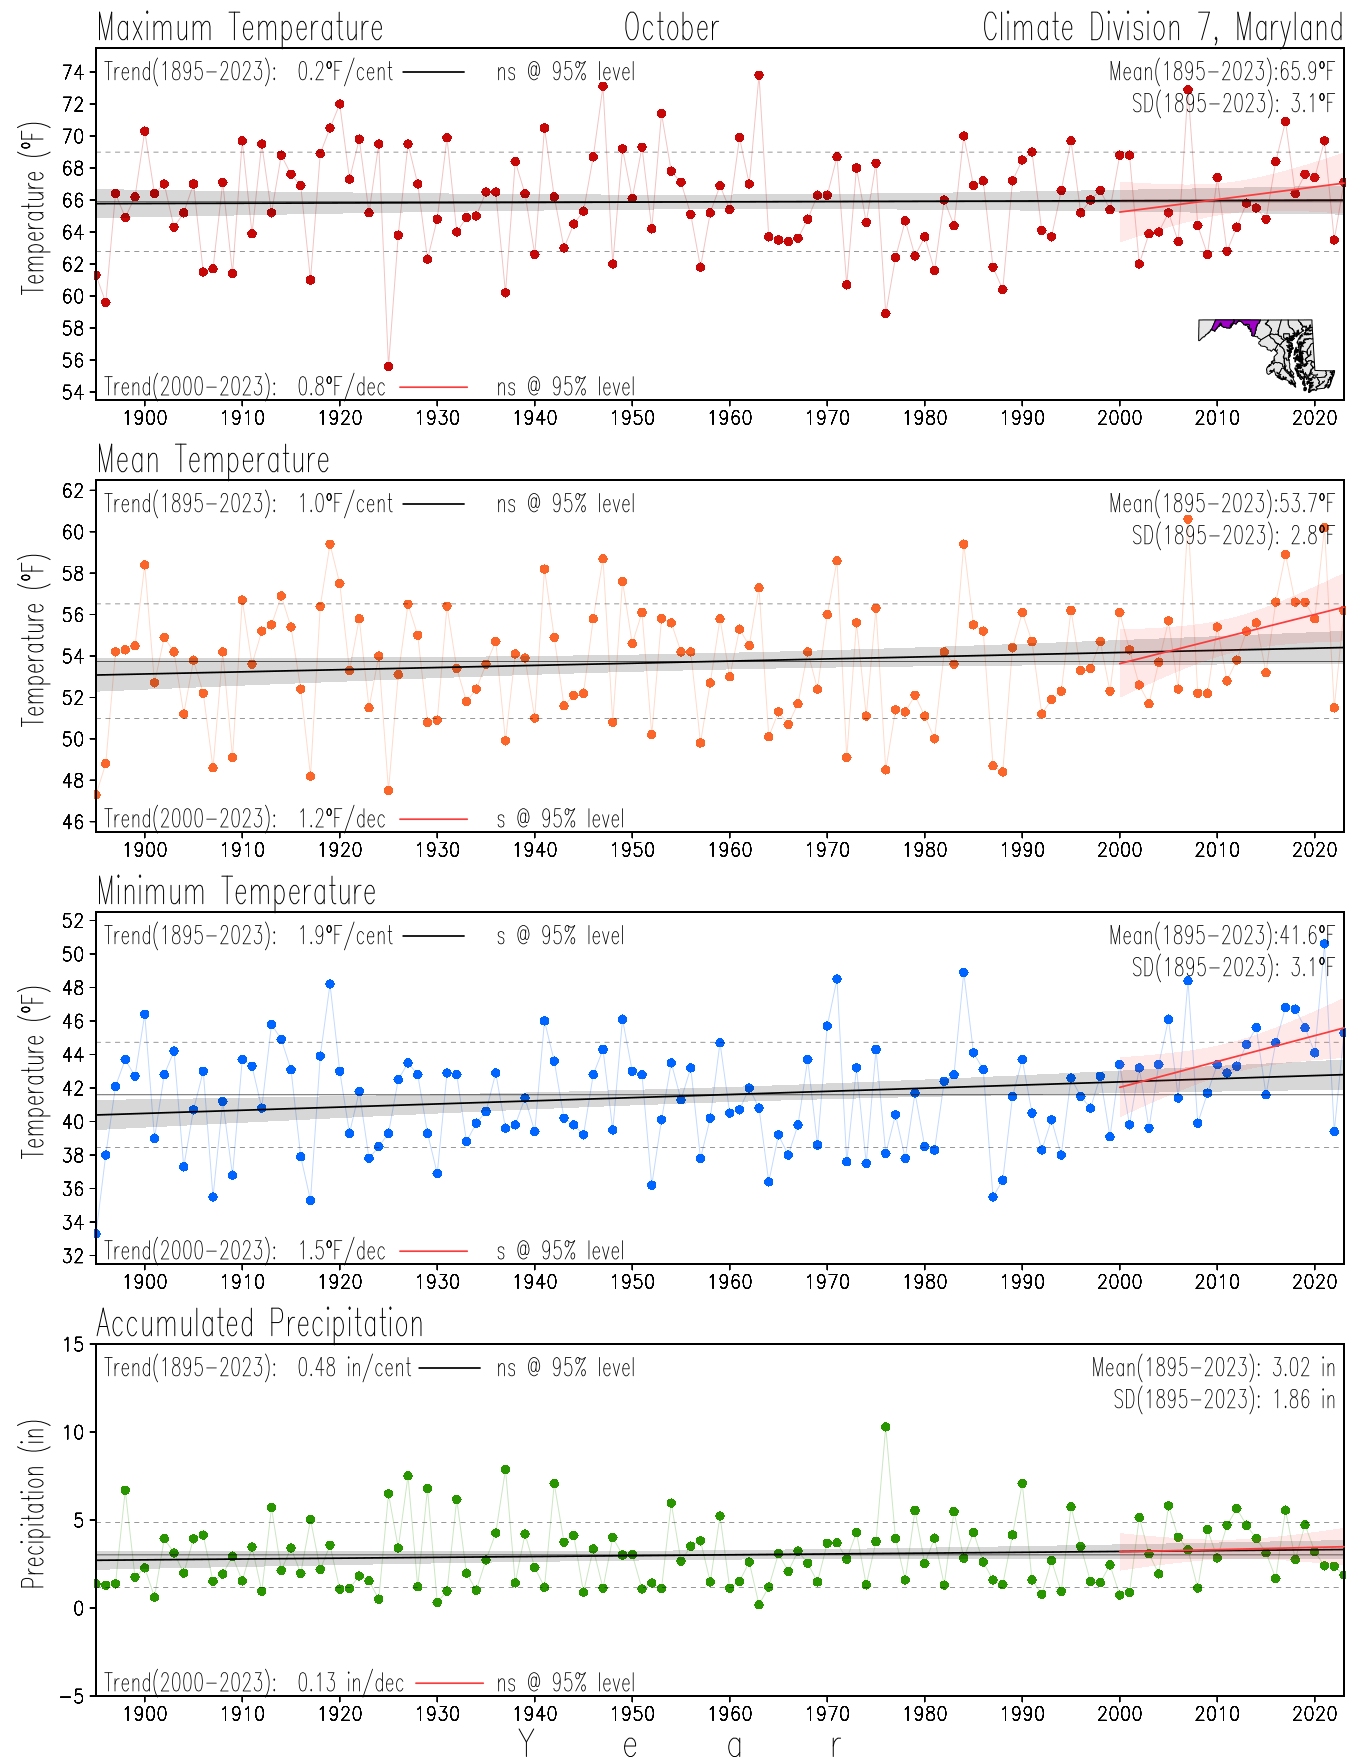
October
×
![]()
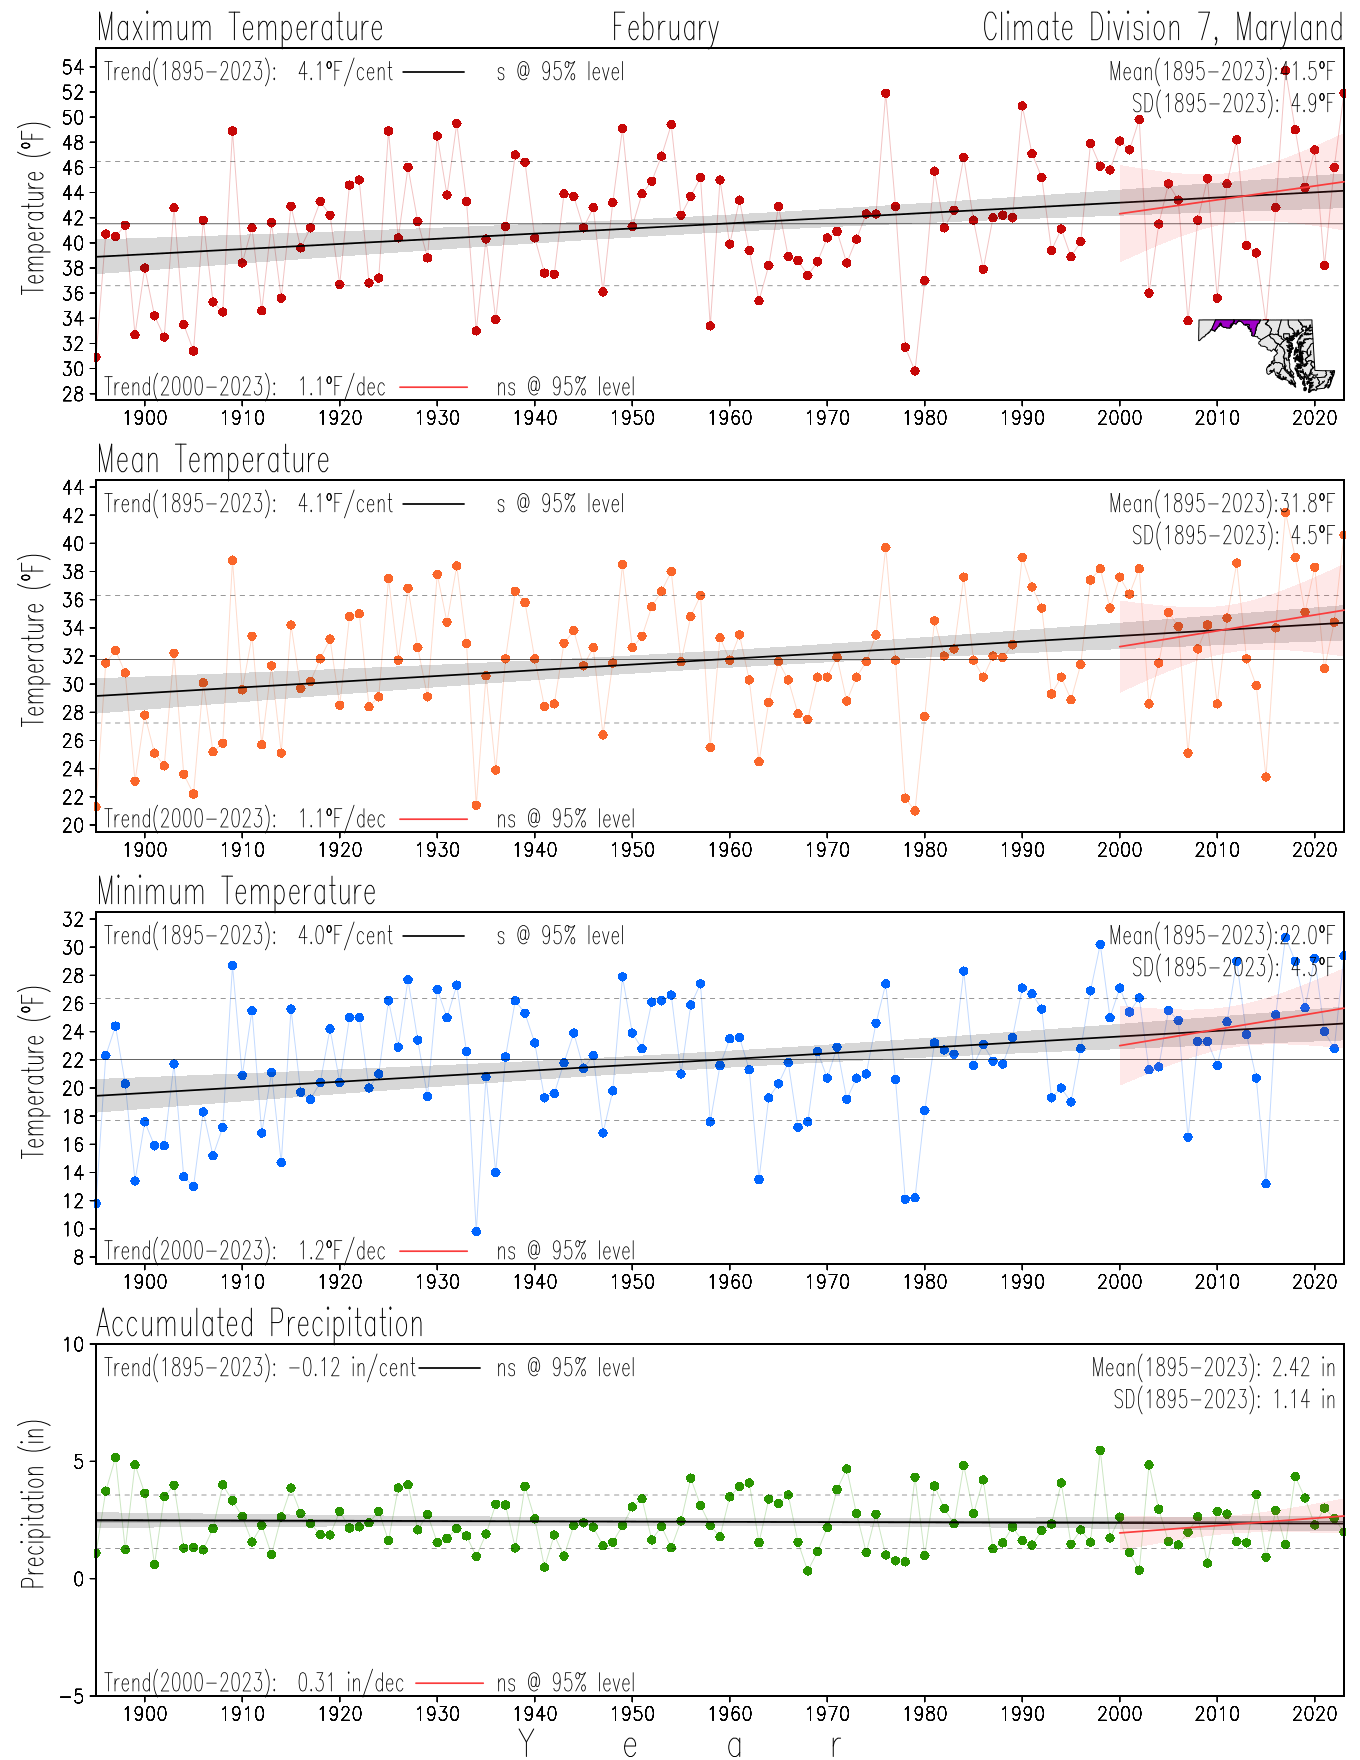
February
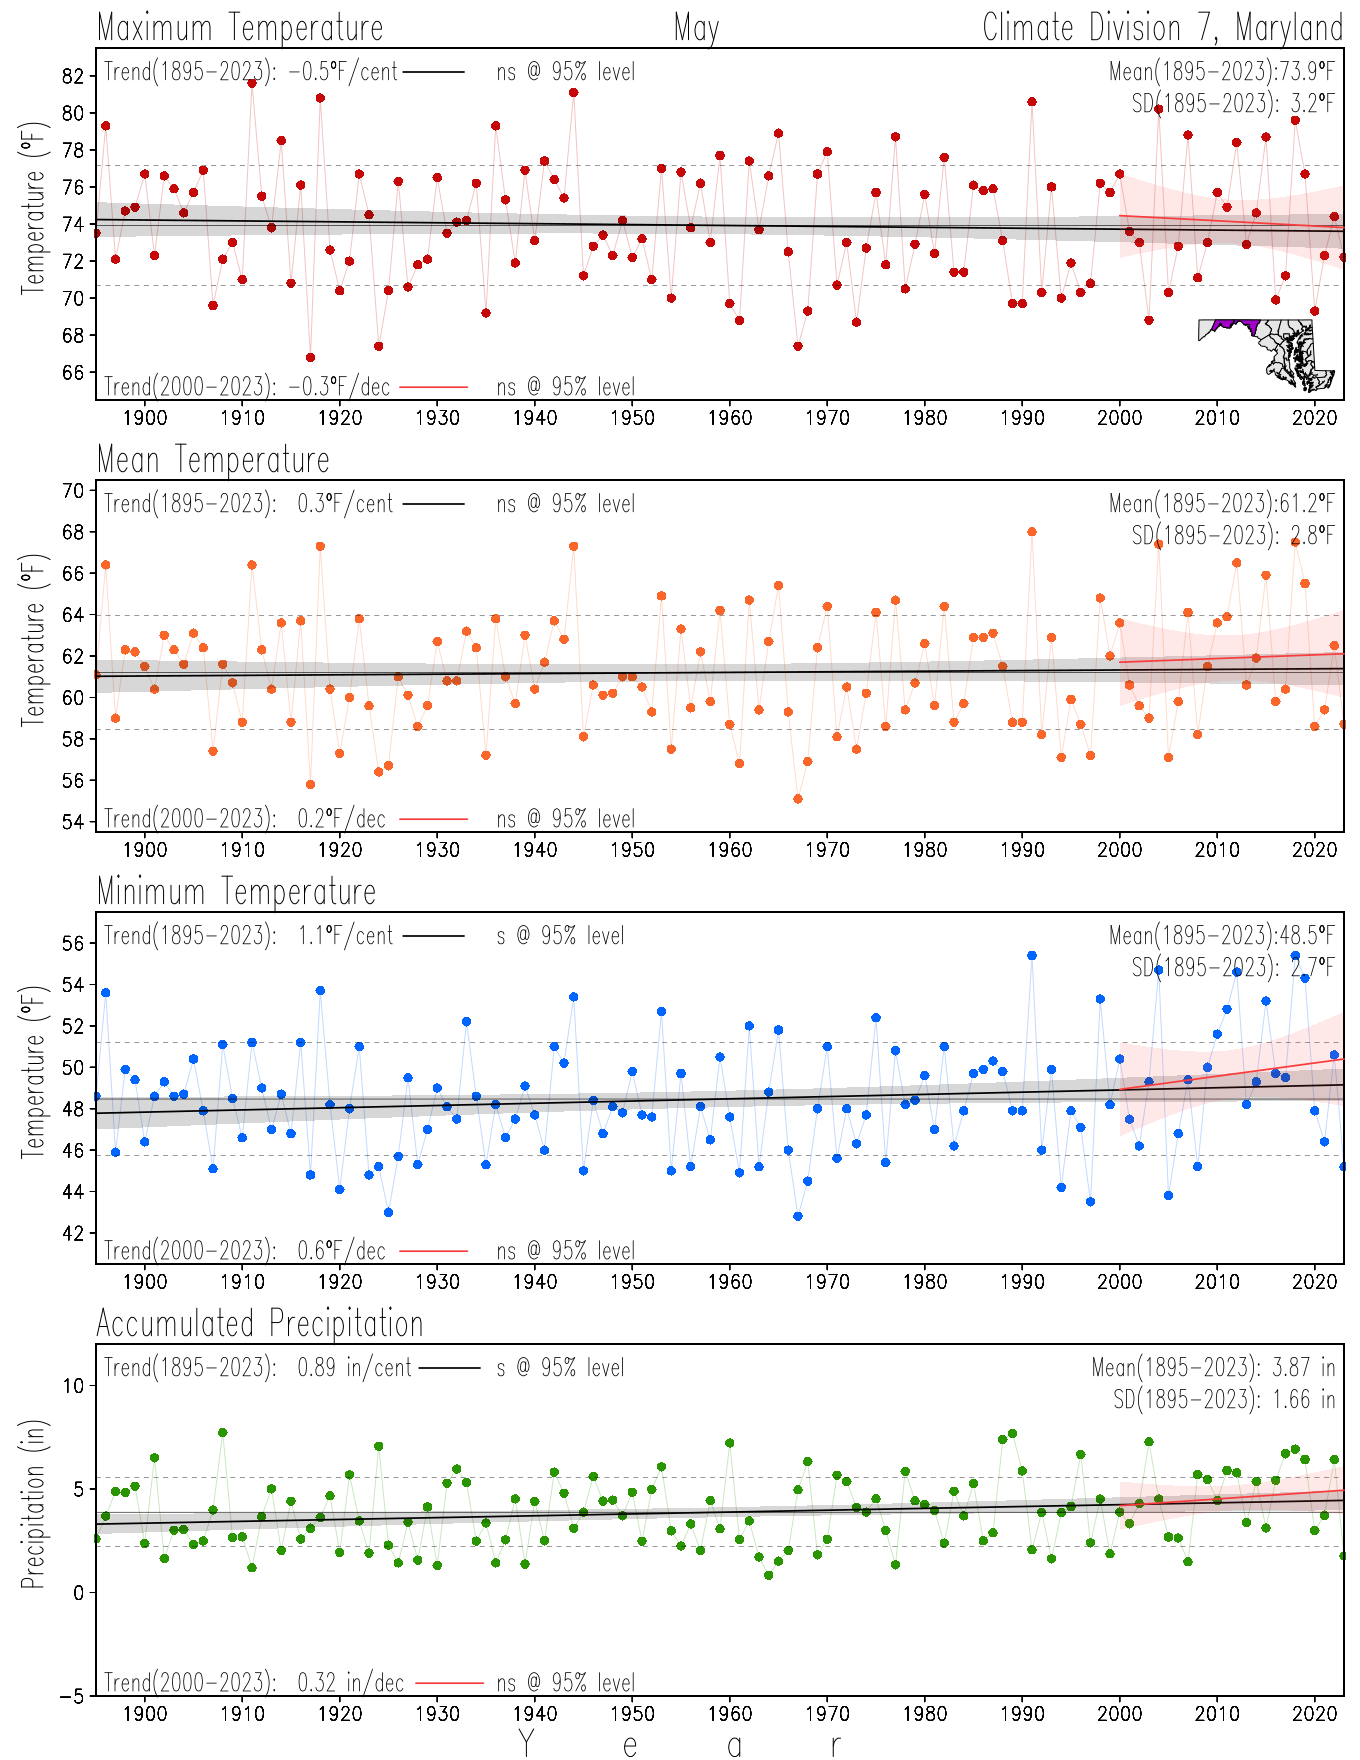
May
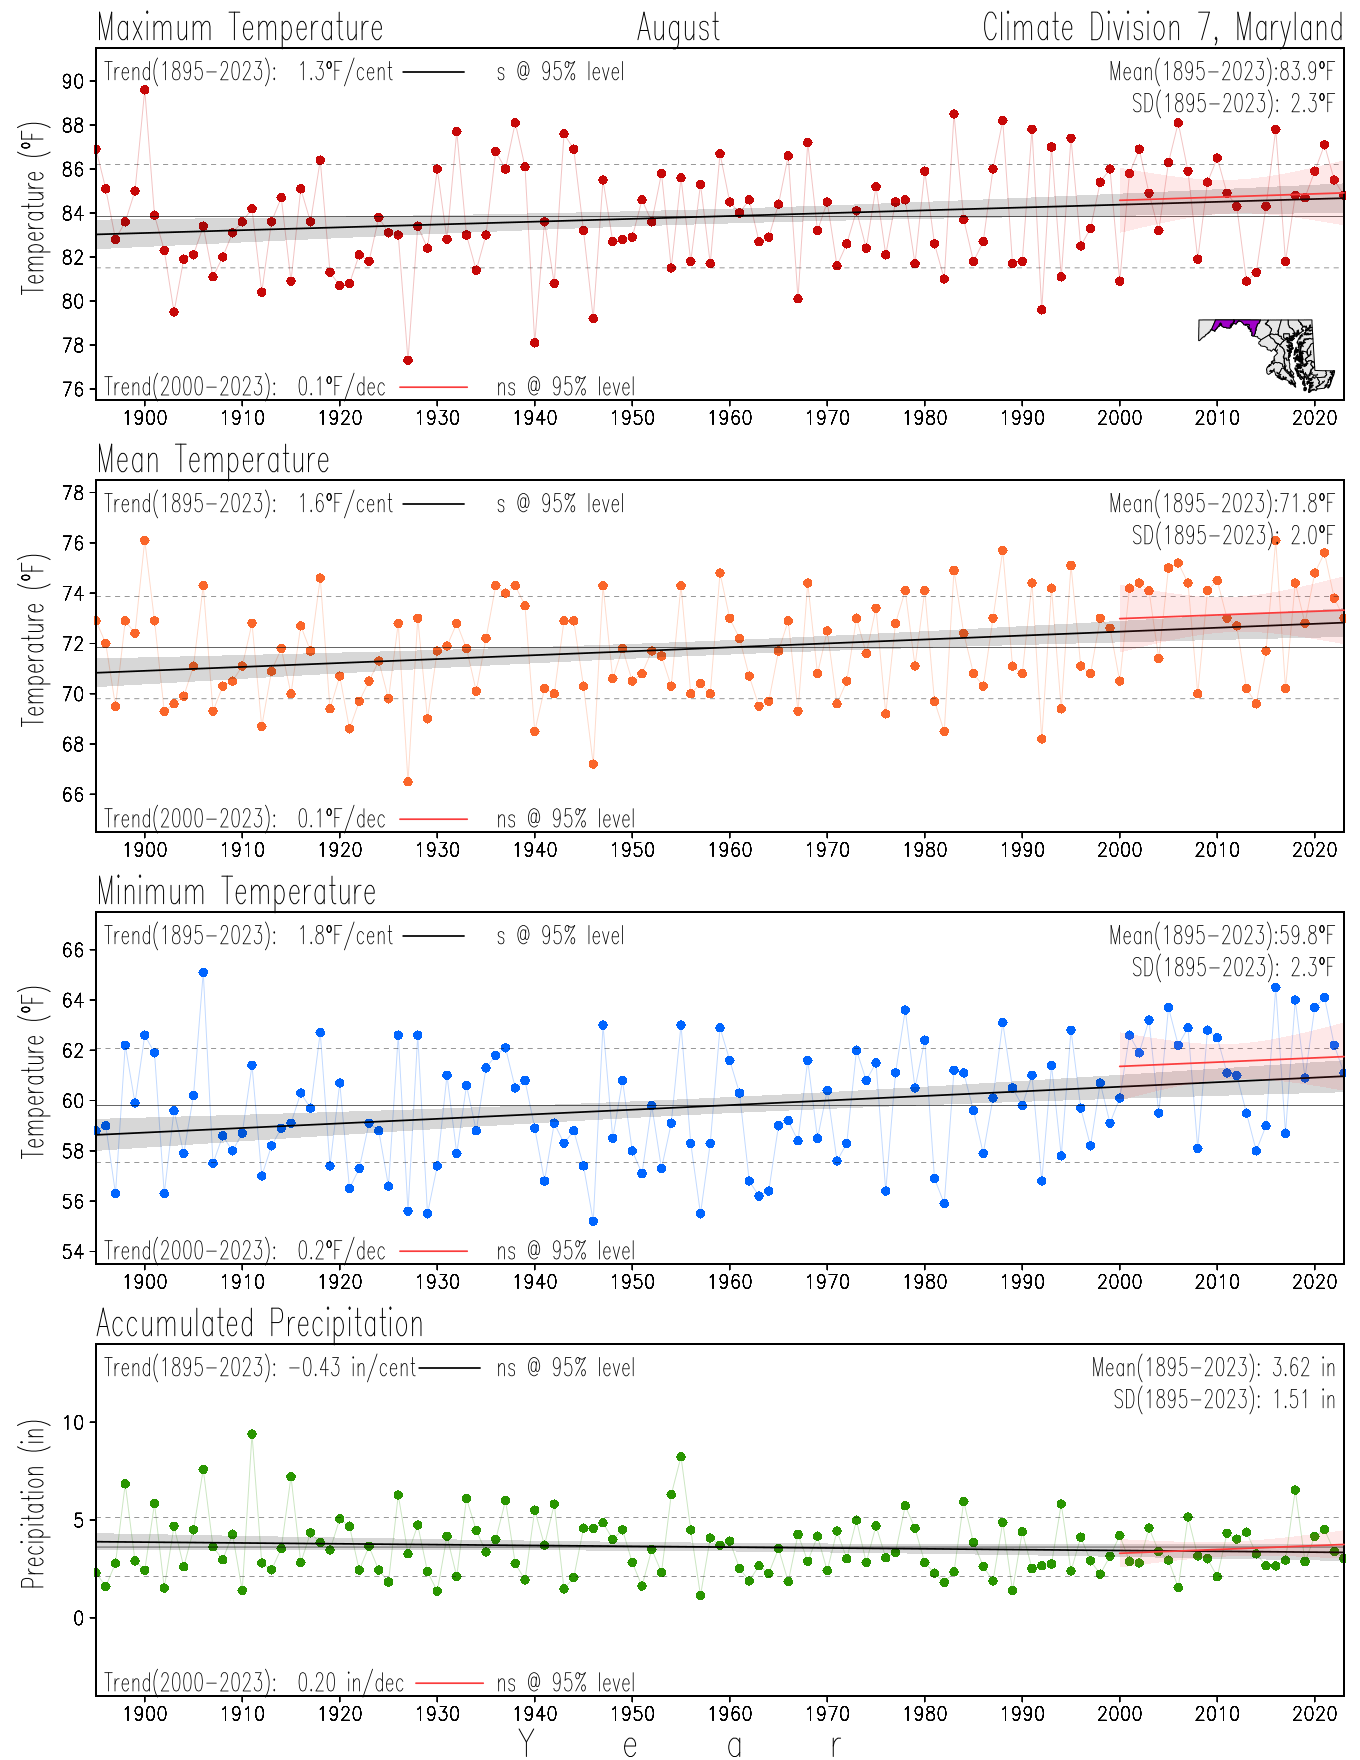
August
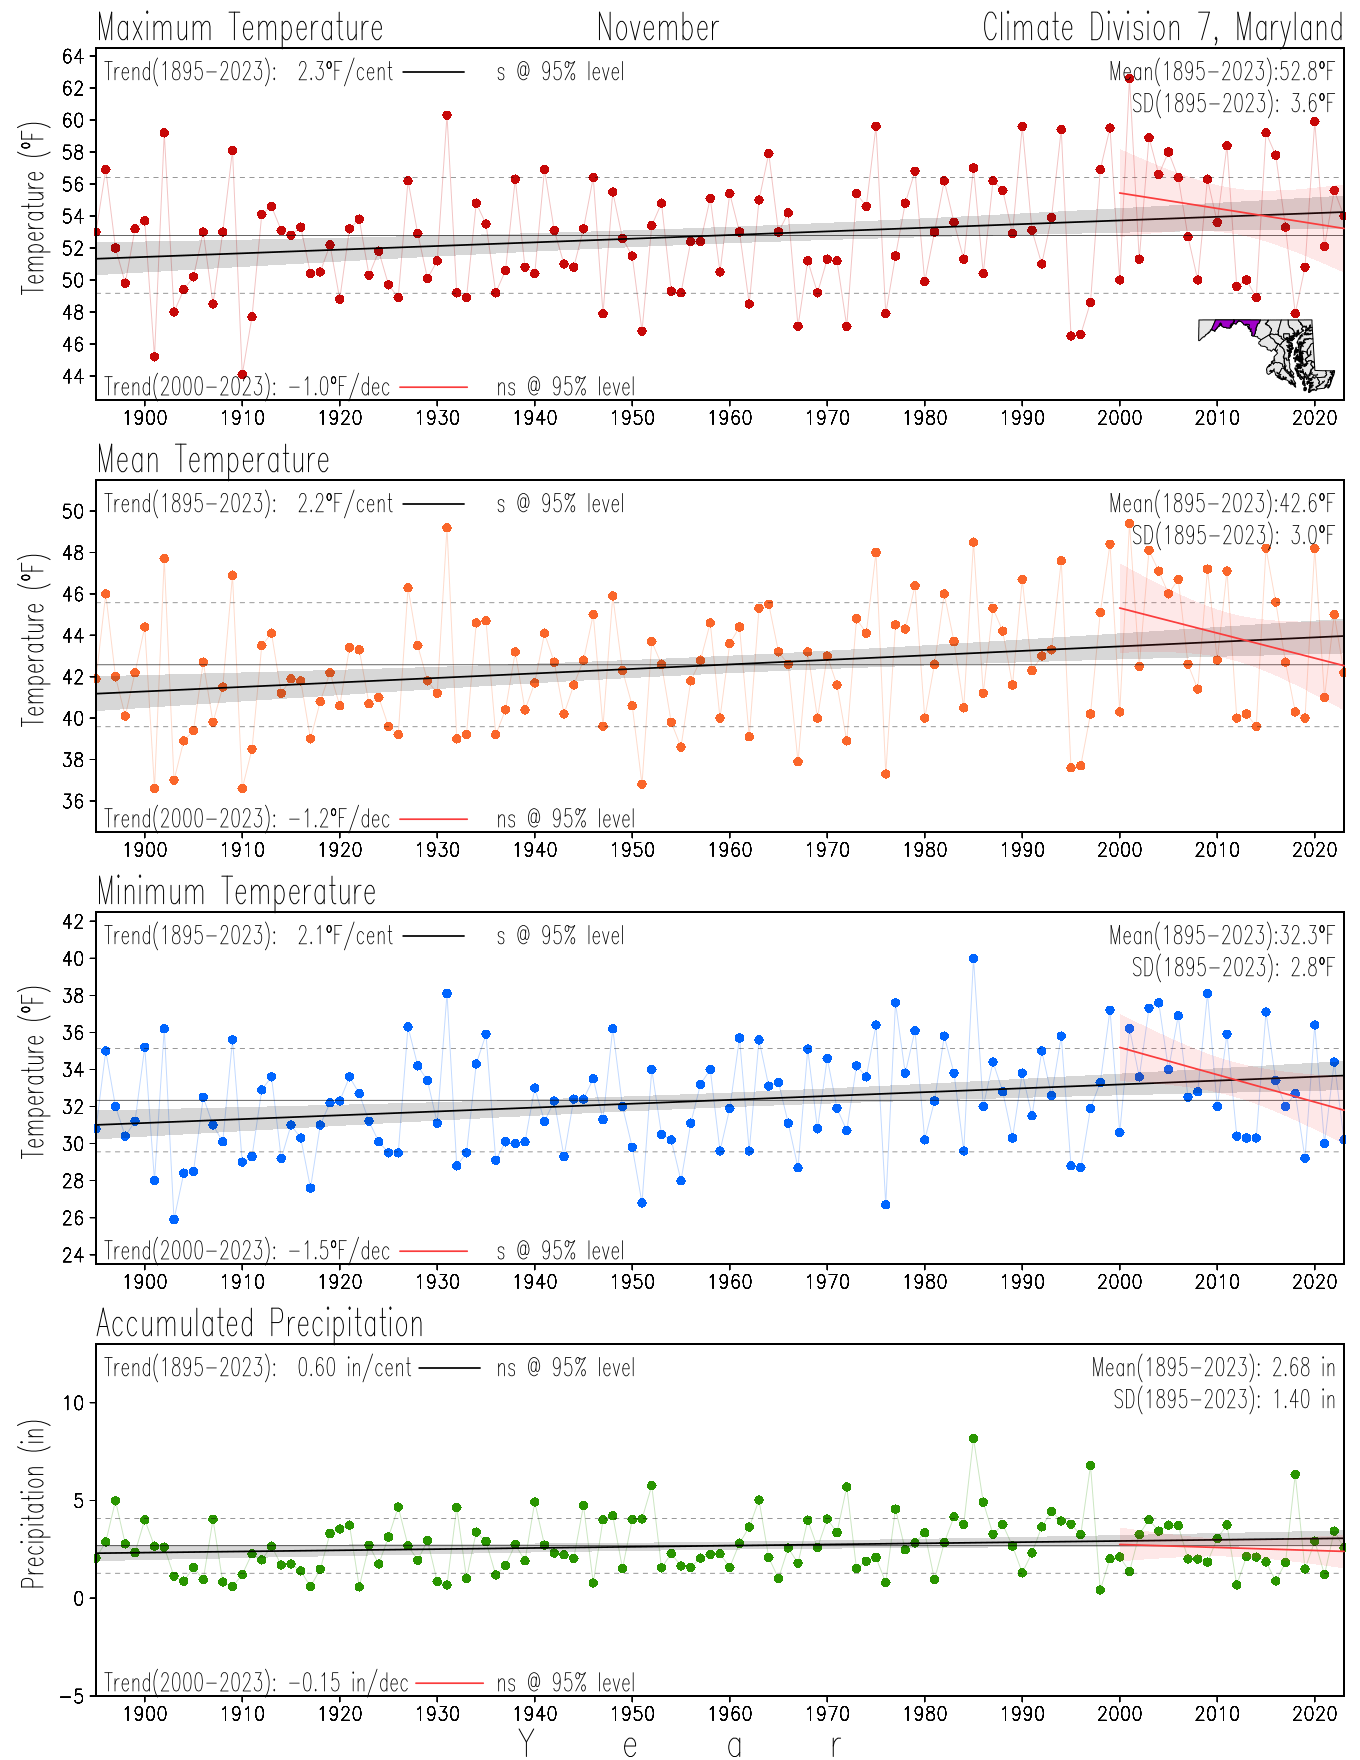
November
Monthly Trends, 1895-2023
×
![]()
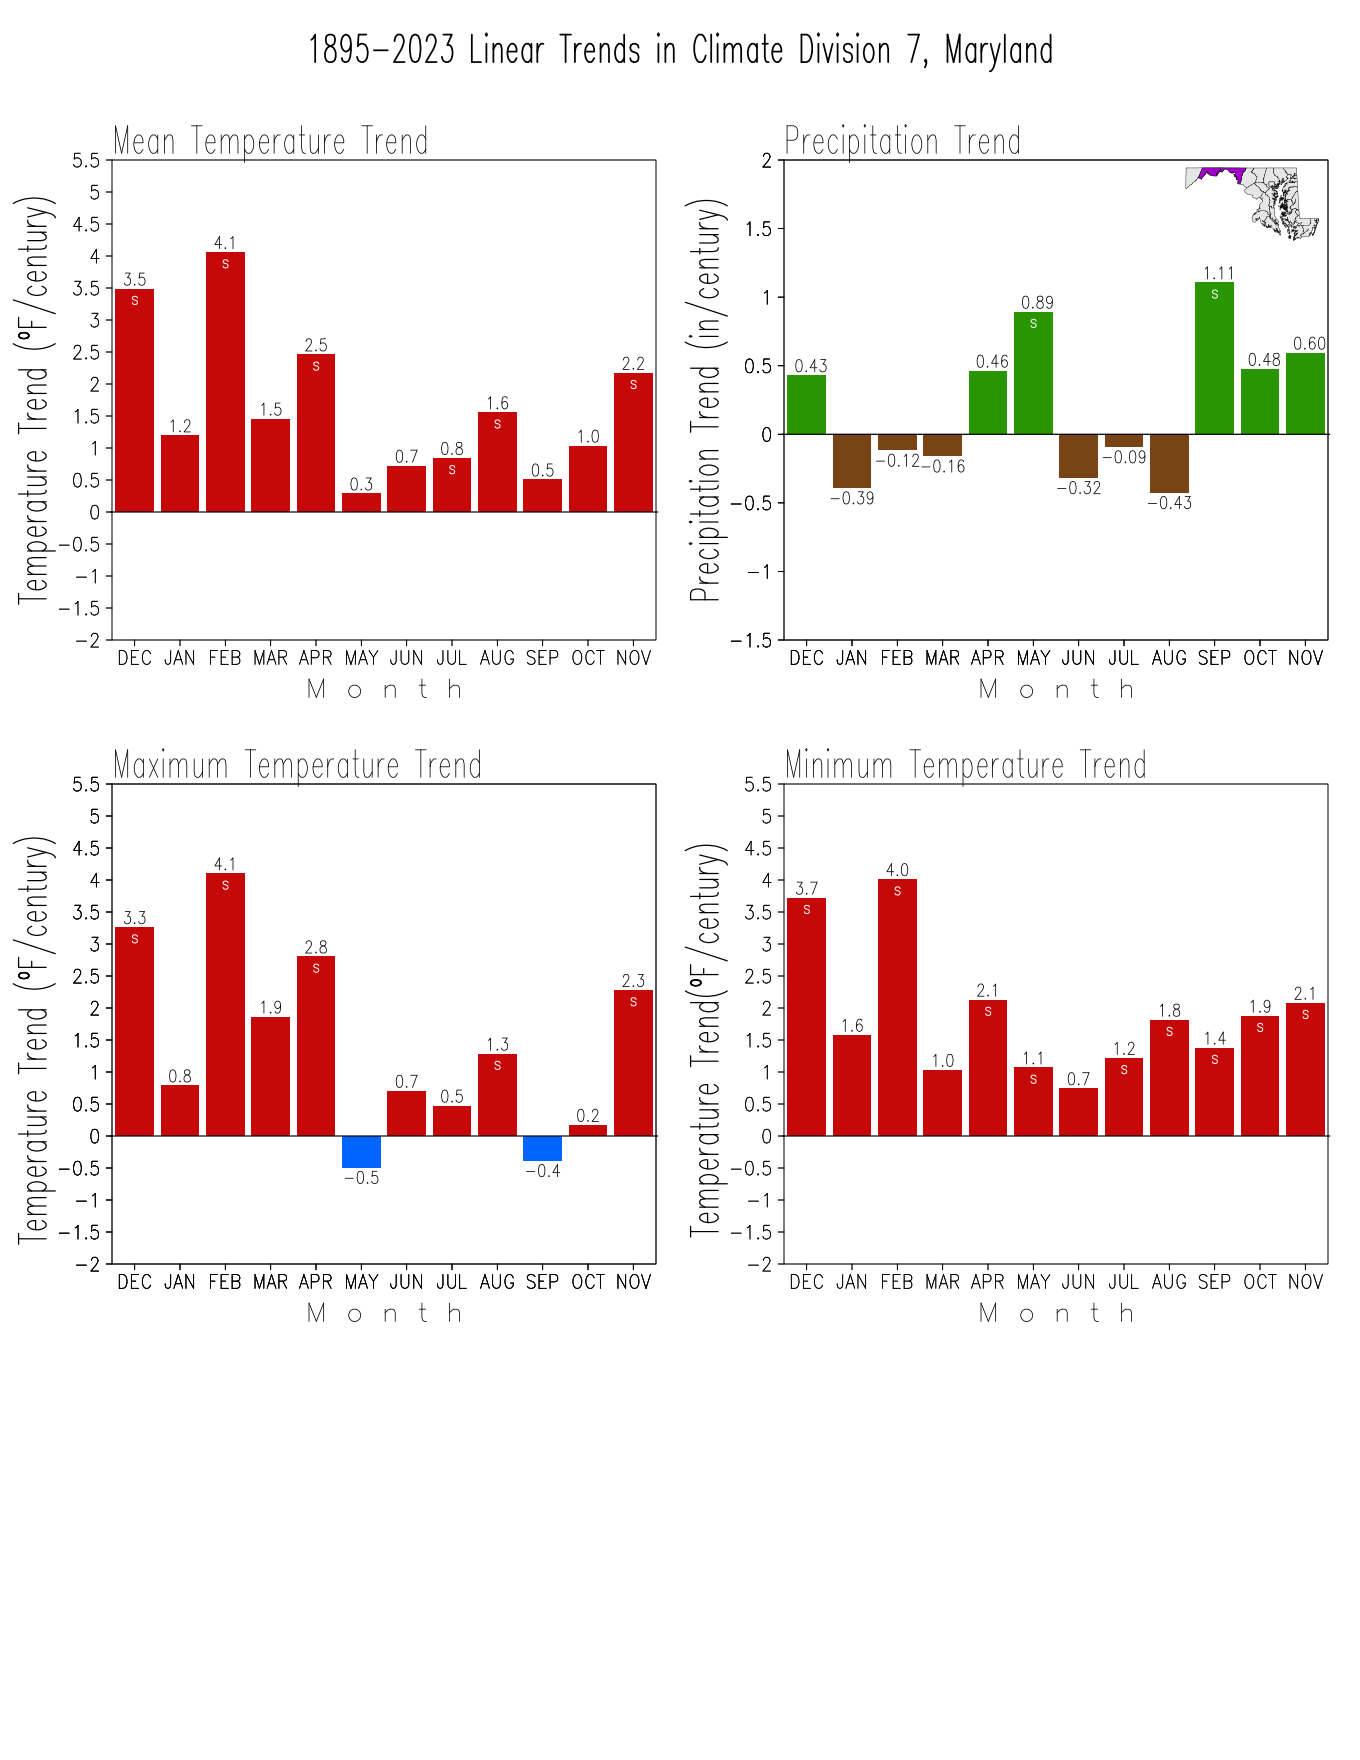
Monthly Trends
Note:The thick black continuos line shows the 1895-2023 linear trend, and the thick red continuos line shows the 2000-2023 linear trend. The thin black line marks the 1895-2023 mean, while the dashed grey lines show the standard deviation (SD) above and below the mean. Trends that are statistically significant at the 95% level (Student’s t-test −Santer et al. 2000) are labeled with a black "s" in the time series and a white "s" in the bar graphs; no significat trends in the time series are labeled with a black "ns" while those in the bar graphs are not labeled.
References