Maryland Climatological Maps, 1991-2020
Weather and climate are closely related, but they are not the same. Weather represents the state of the atmosphere (temperature, precipitation, etc.) at any given time. On the other hand, climate refers to the time average of the weather elements when the average is over long periods. If the average period is long enough, we can start to characterize the climate of a particular region.
It is customary to follow the World Meteorological Organization (WMO) recommendation and use 30 years for the average. The 30-year averaged weather data is traditionally known as Climate Normal (Kunkel and Court 1990), which is updated every ten years (WMO 2017). Establishing a climate normal or climatology is important as it allows one to compare a specific day, month, season, or even another normal period with the current normal. Such comparisons characterize anomalous weather and climate conditions, climate variability and change, and help define extreme weather and climate events (Arguez et al. 2012). The current climate normal, or just the climatology, is defined for 1991‒2020.
The data set used in the plots displayed in this page is NOAA's Monthly U.S. Climate Gridded Dataset at 5km horizontal resolution (NClimGrid, Vose et al. 2014). This data set provides surface monthly data over continental U.S. for the period 1895-present, which is used to elaborate maps at the seasonal and annual resolutions.
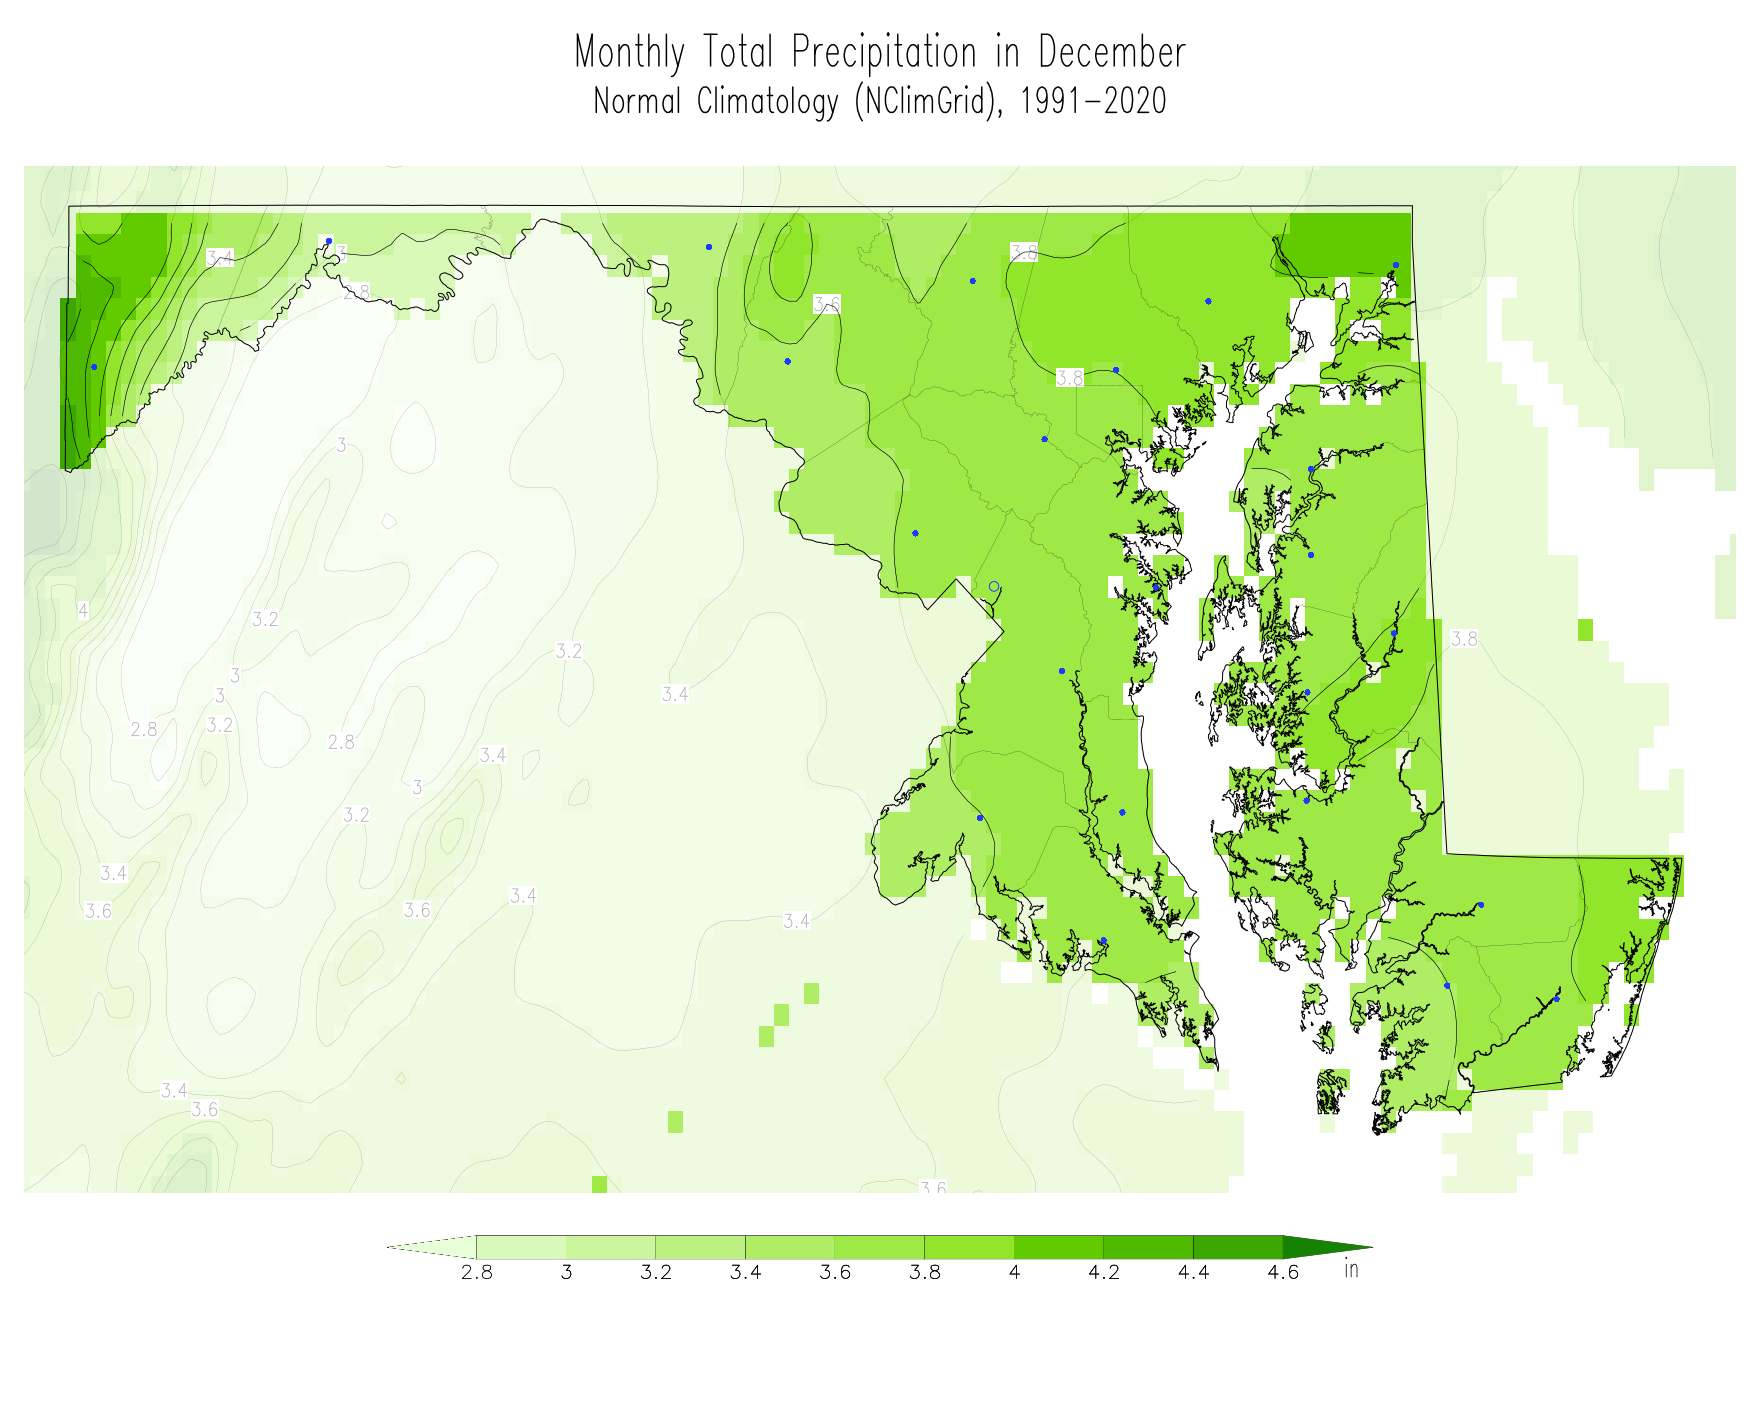
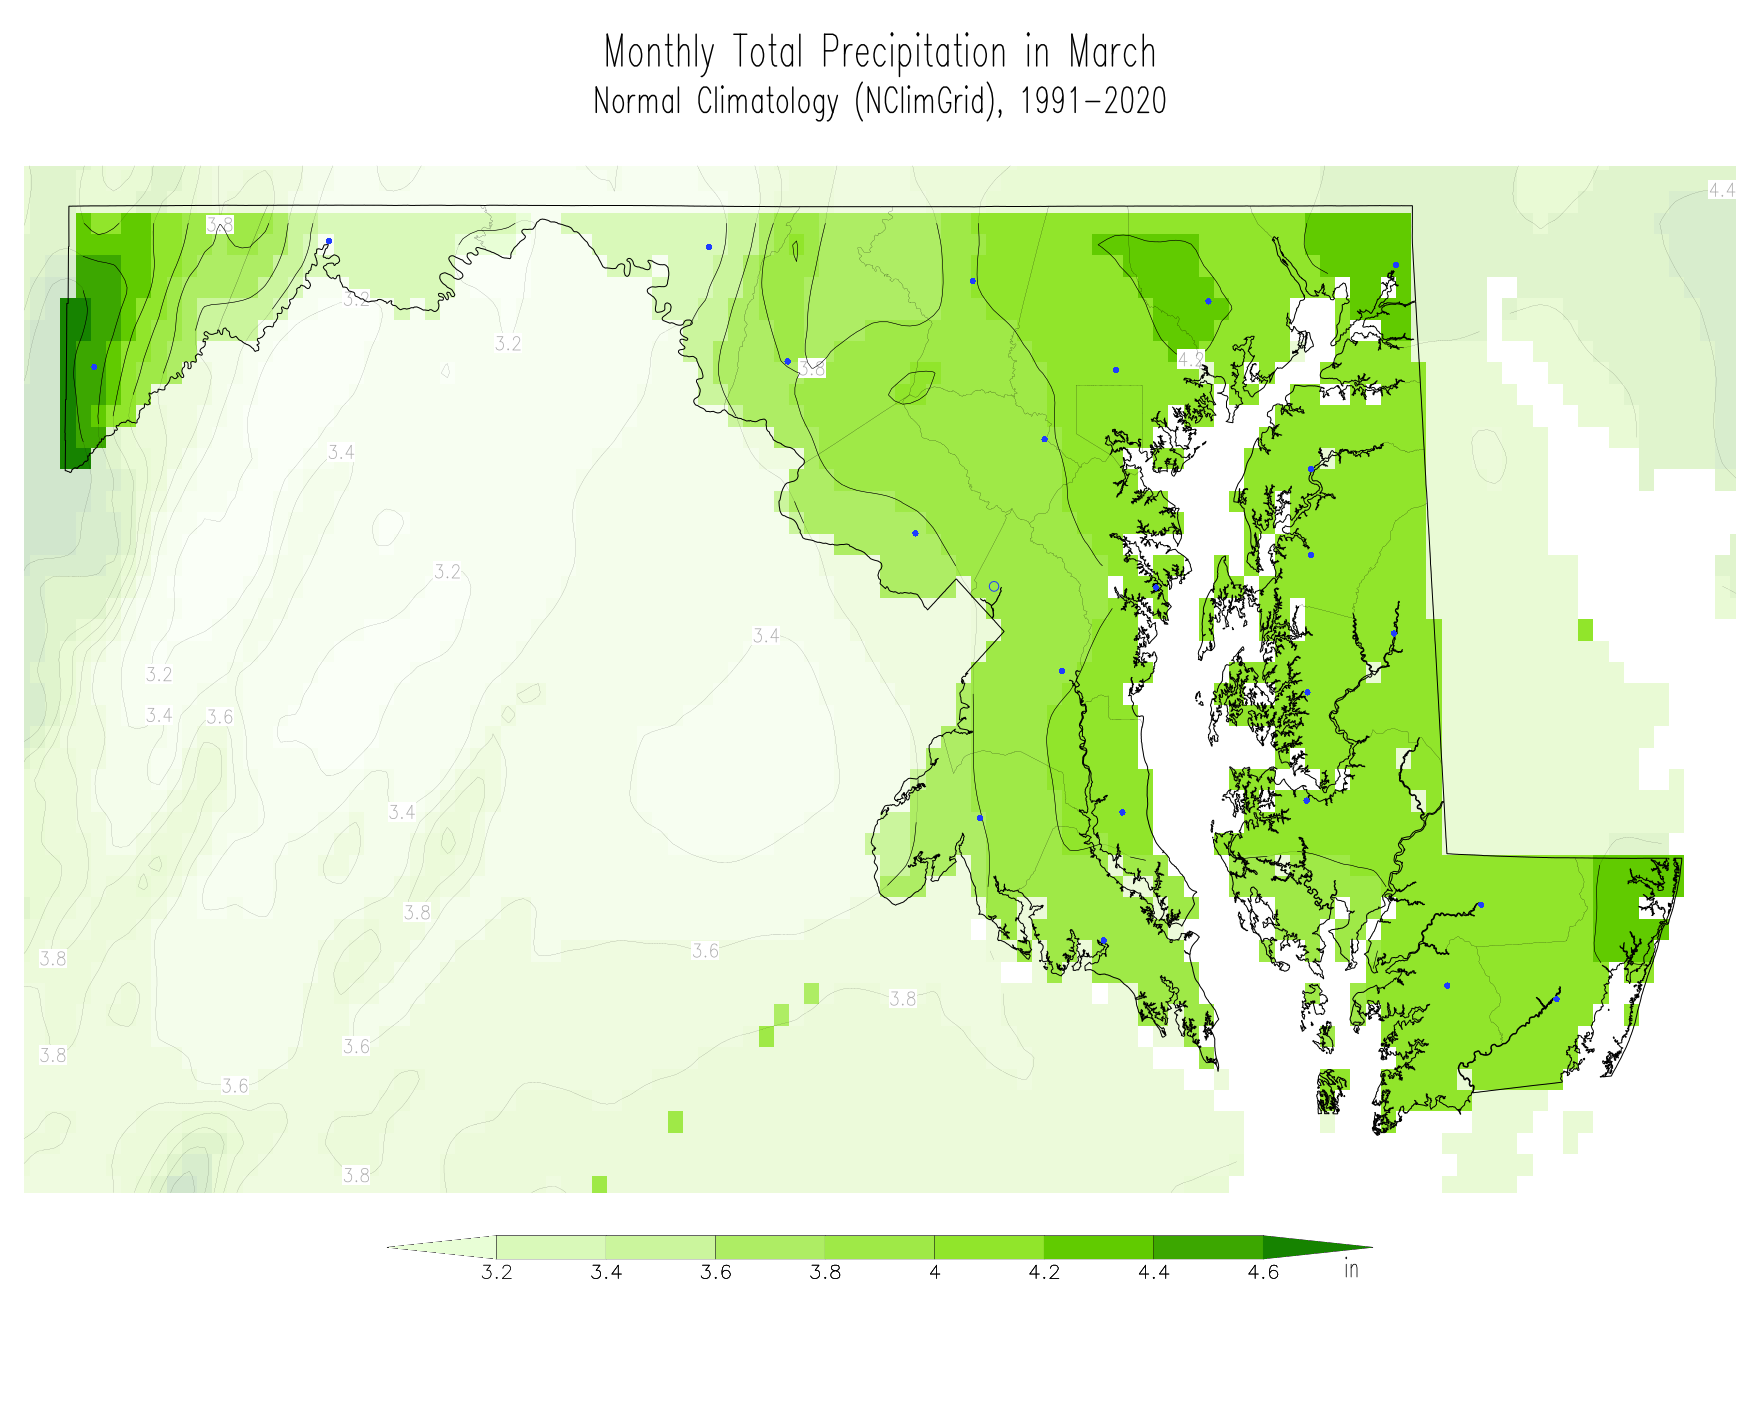
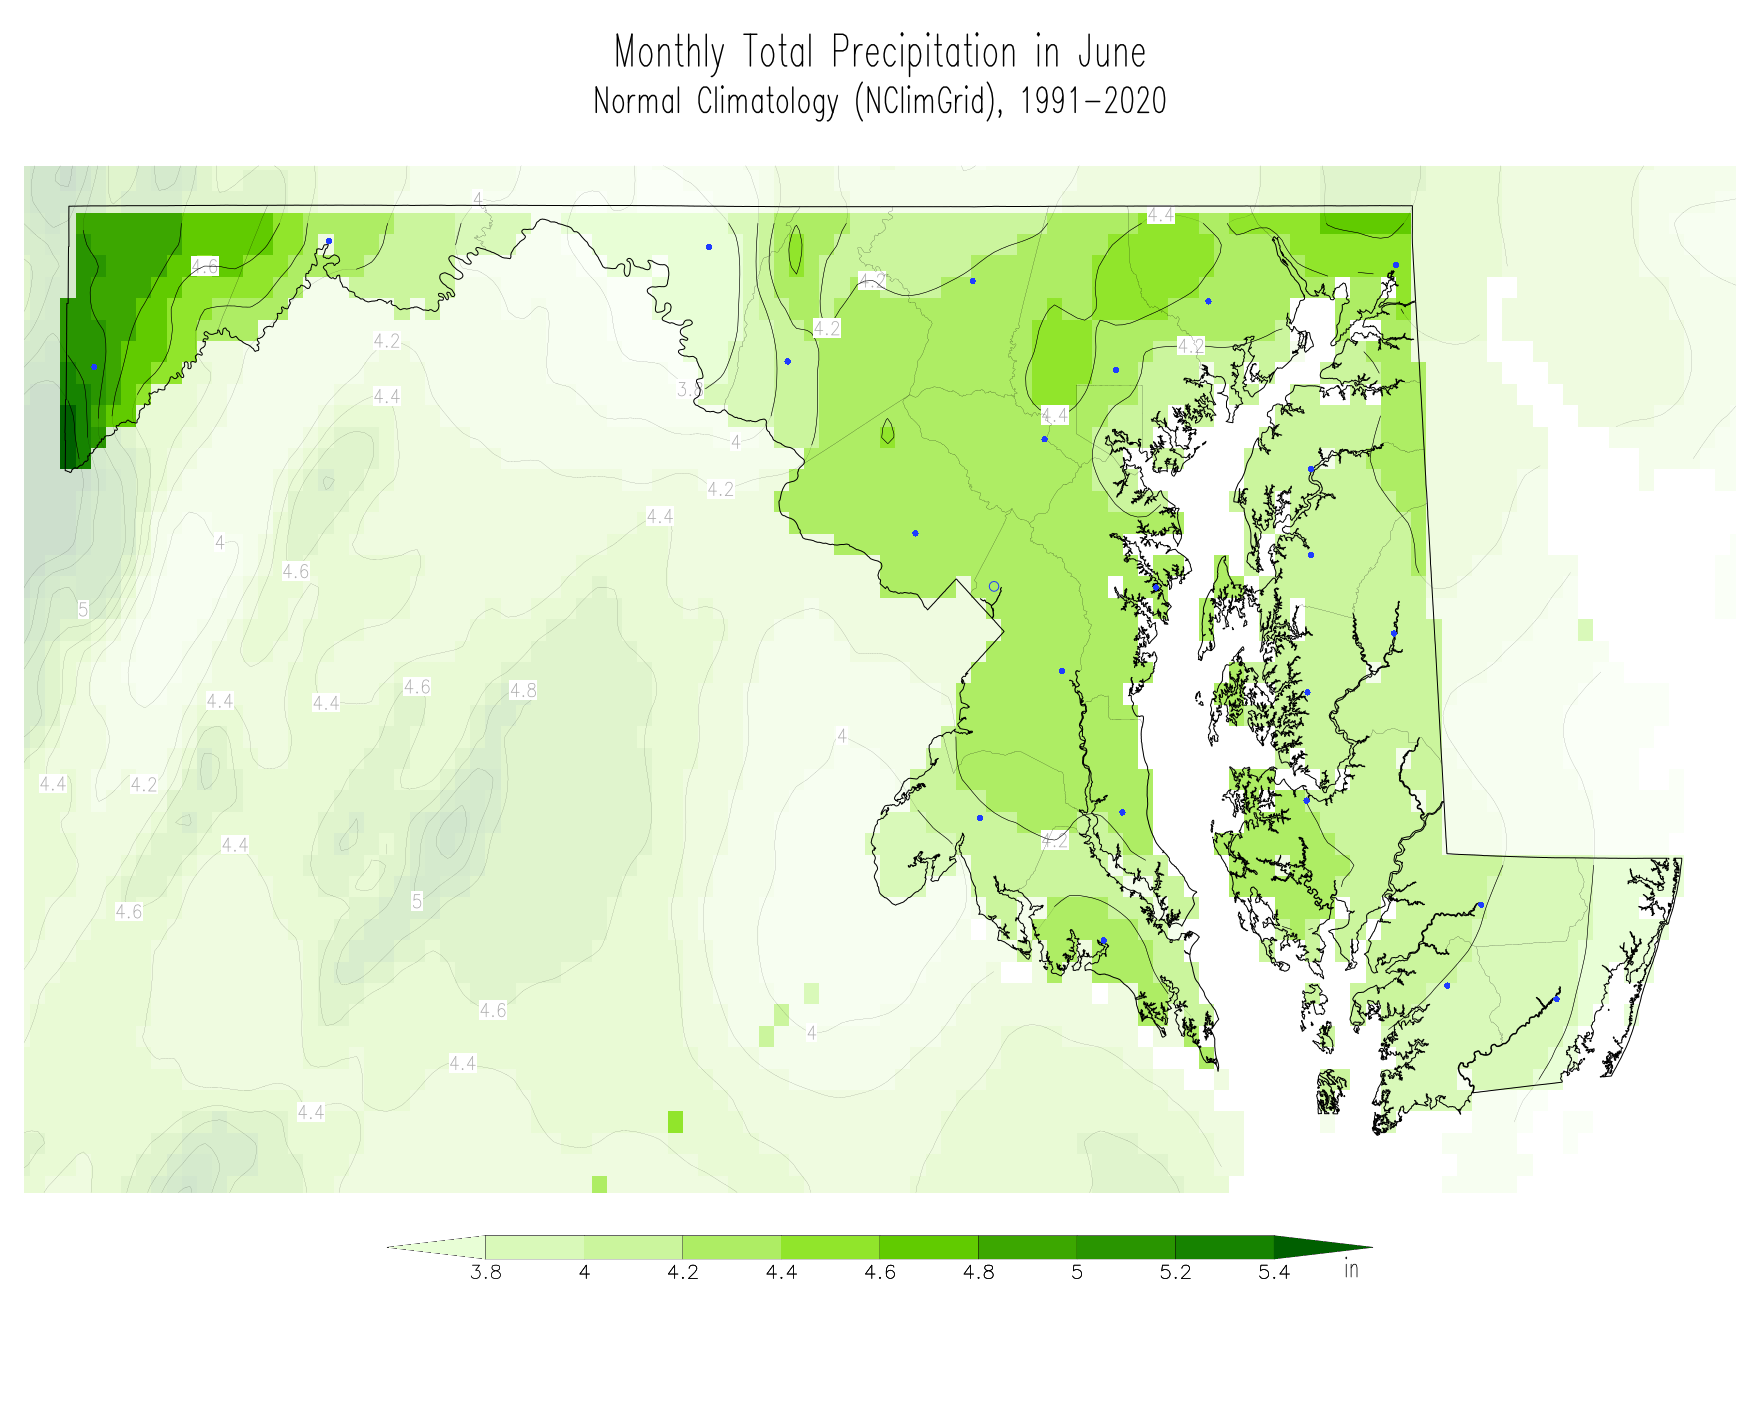
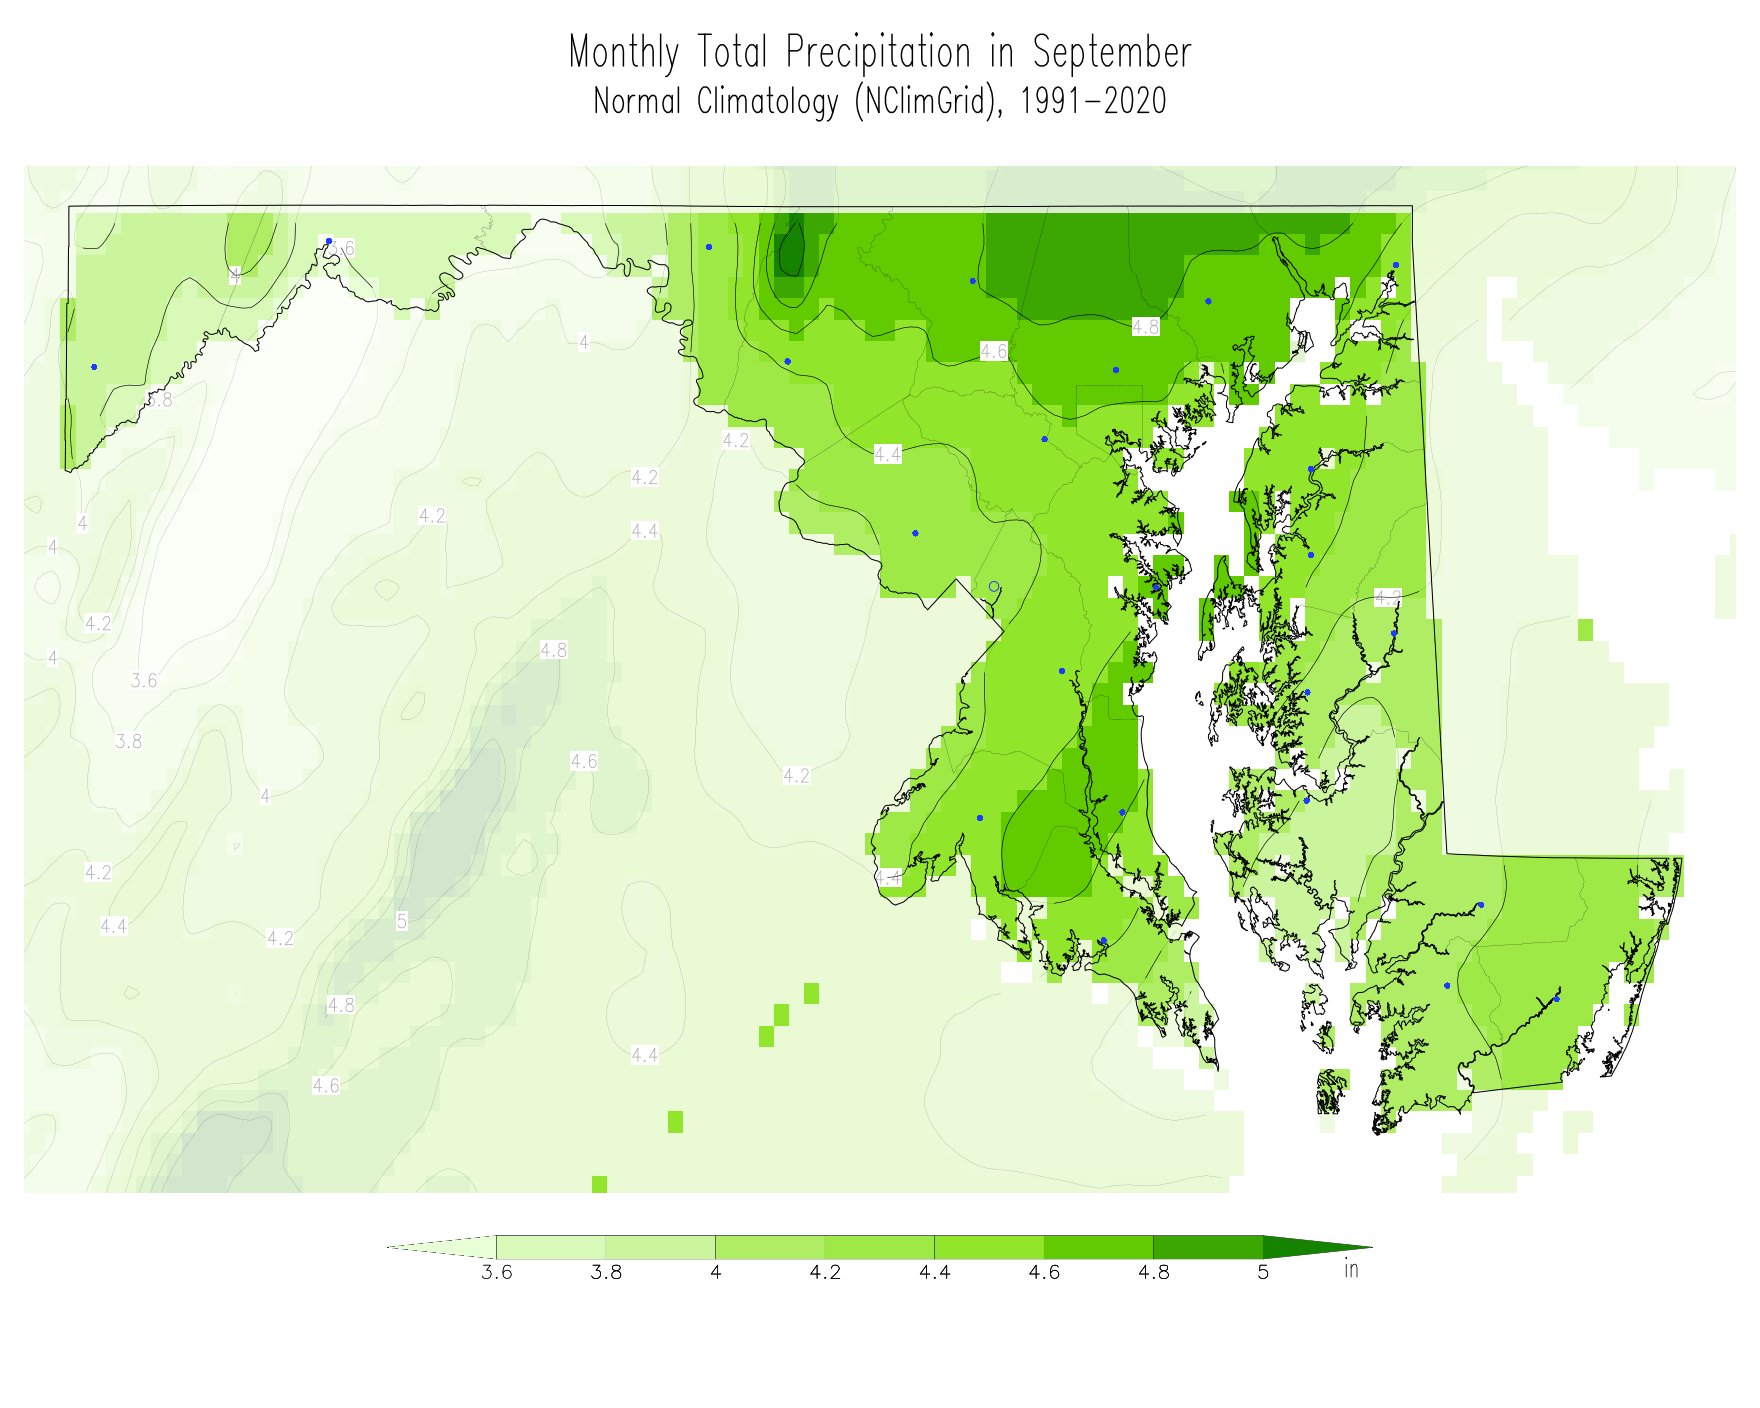
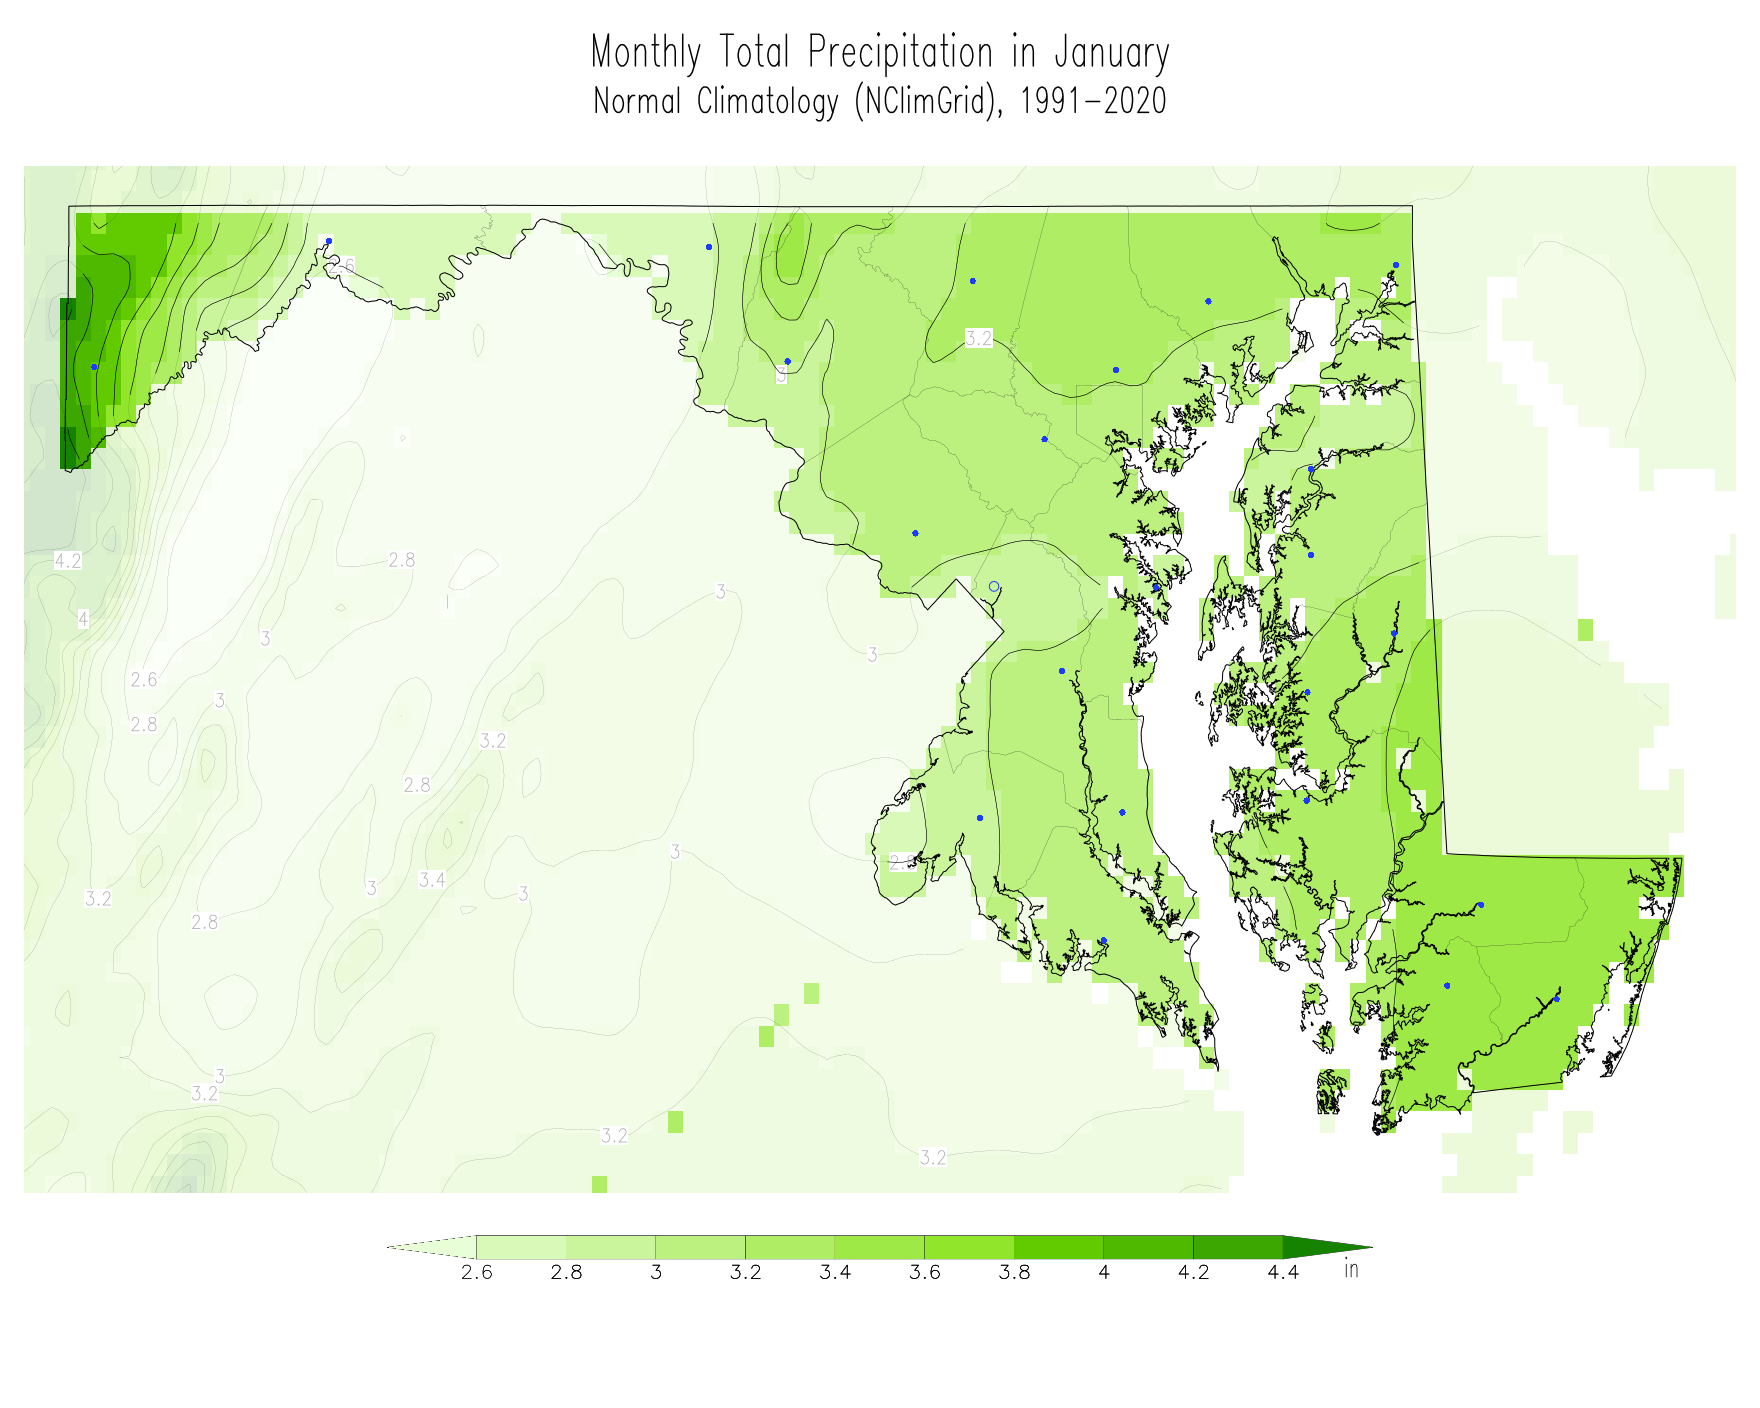
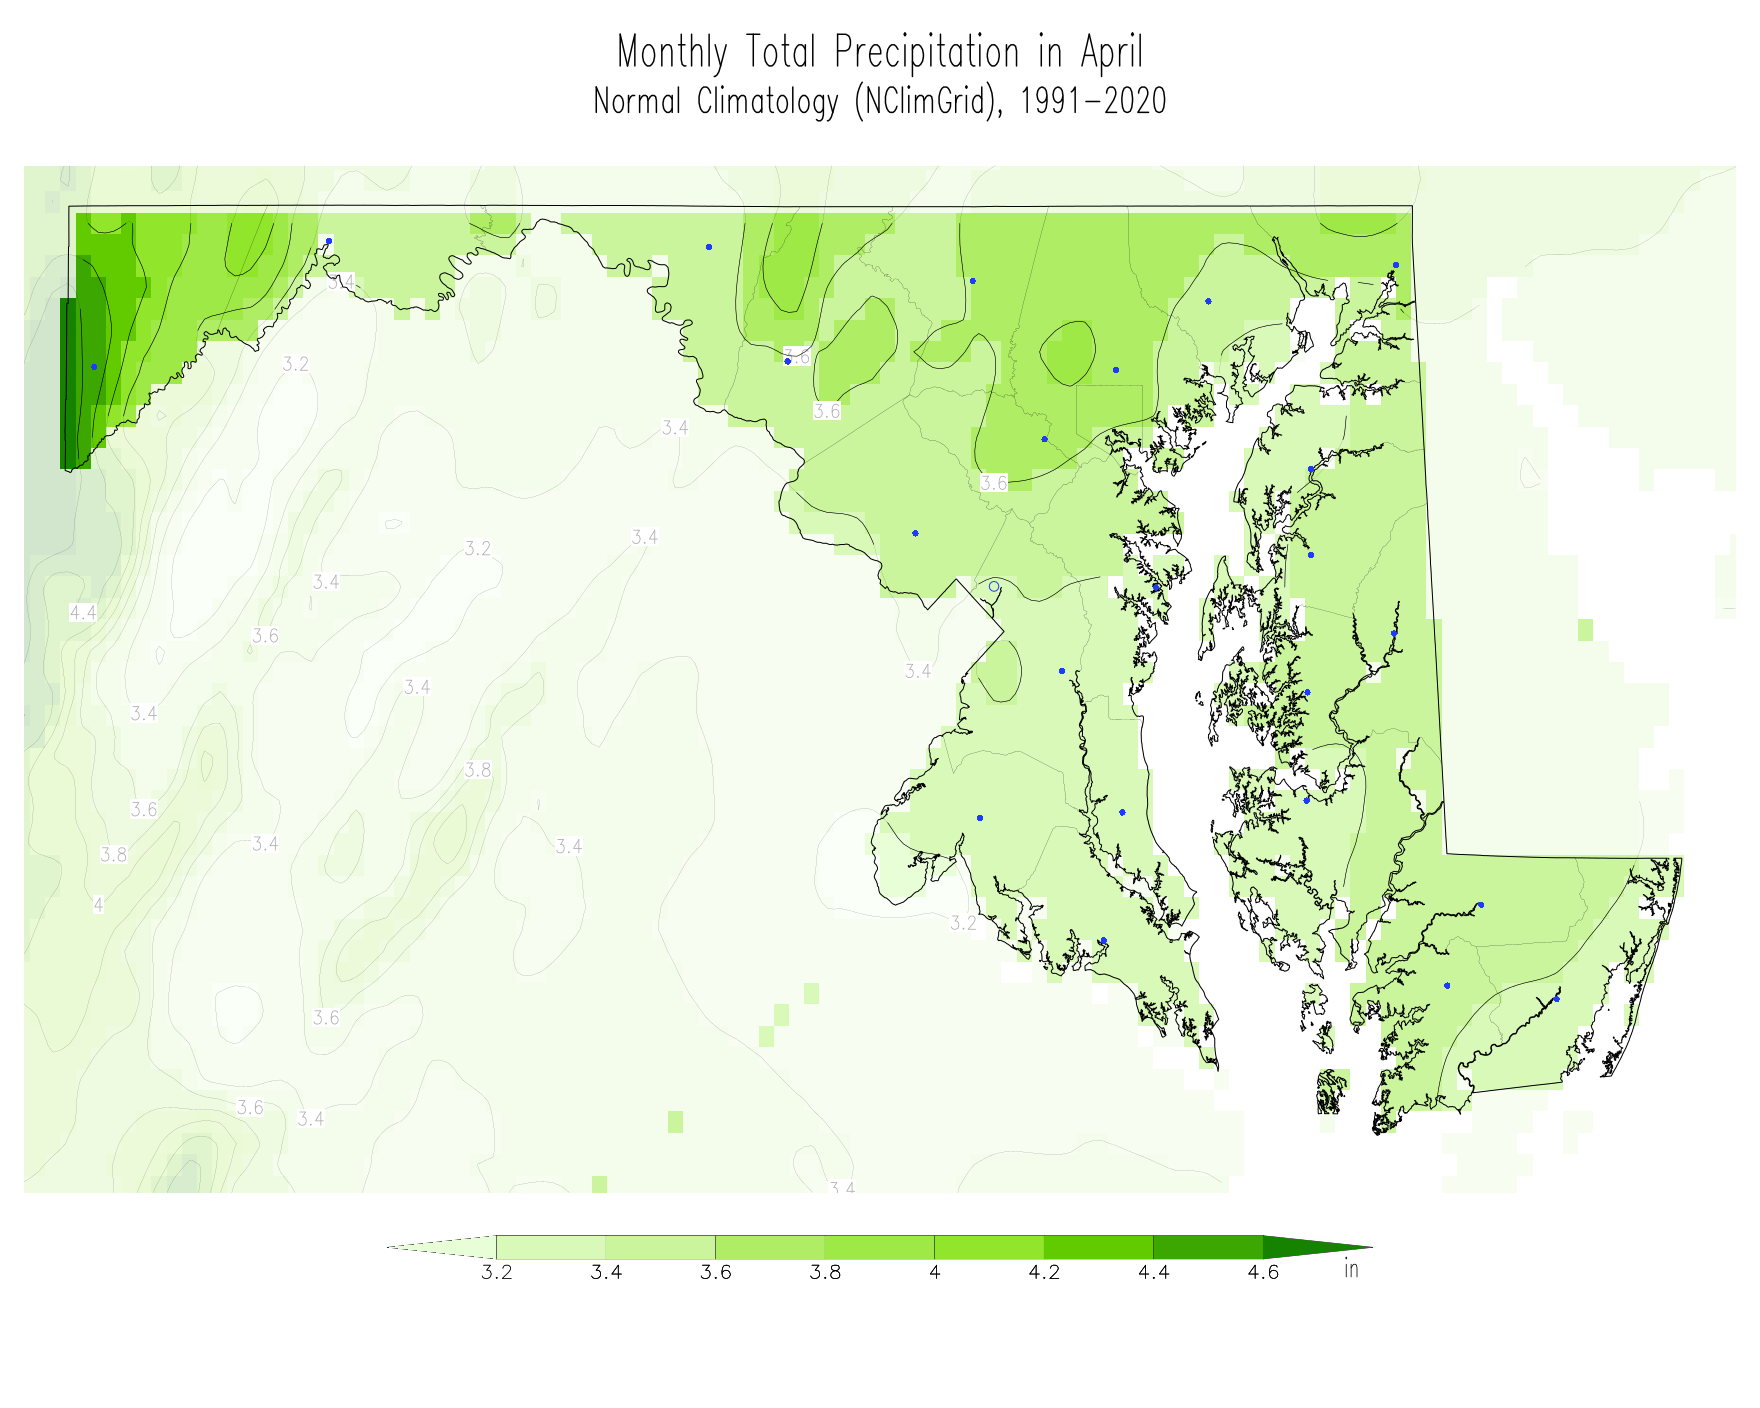
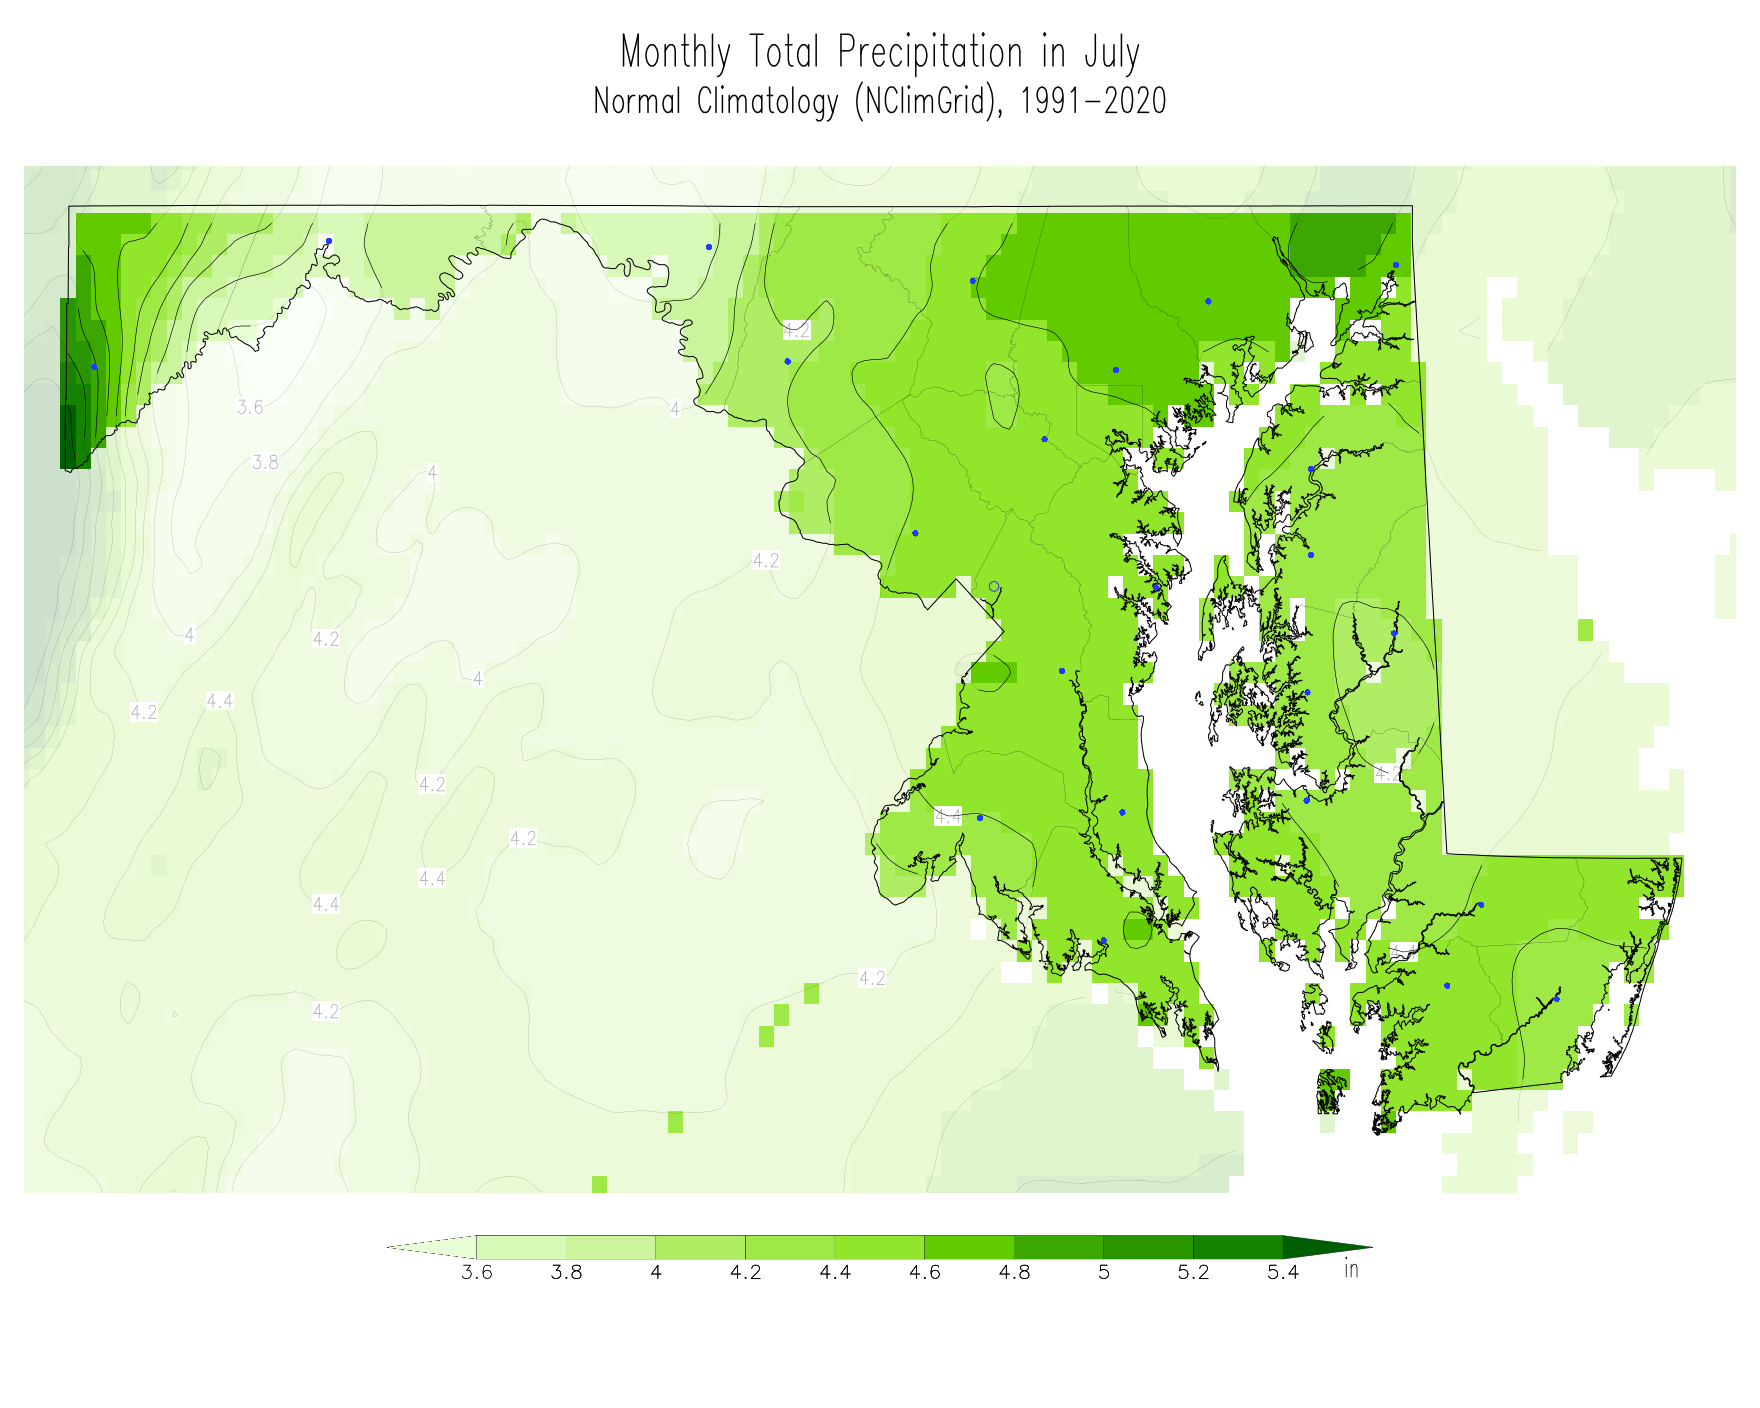
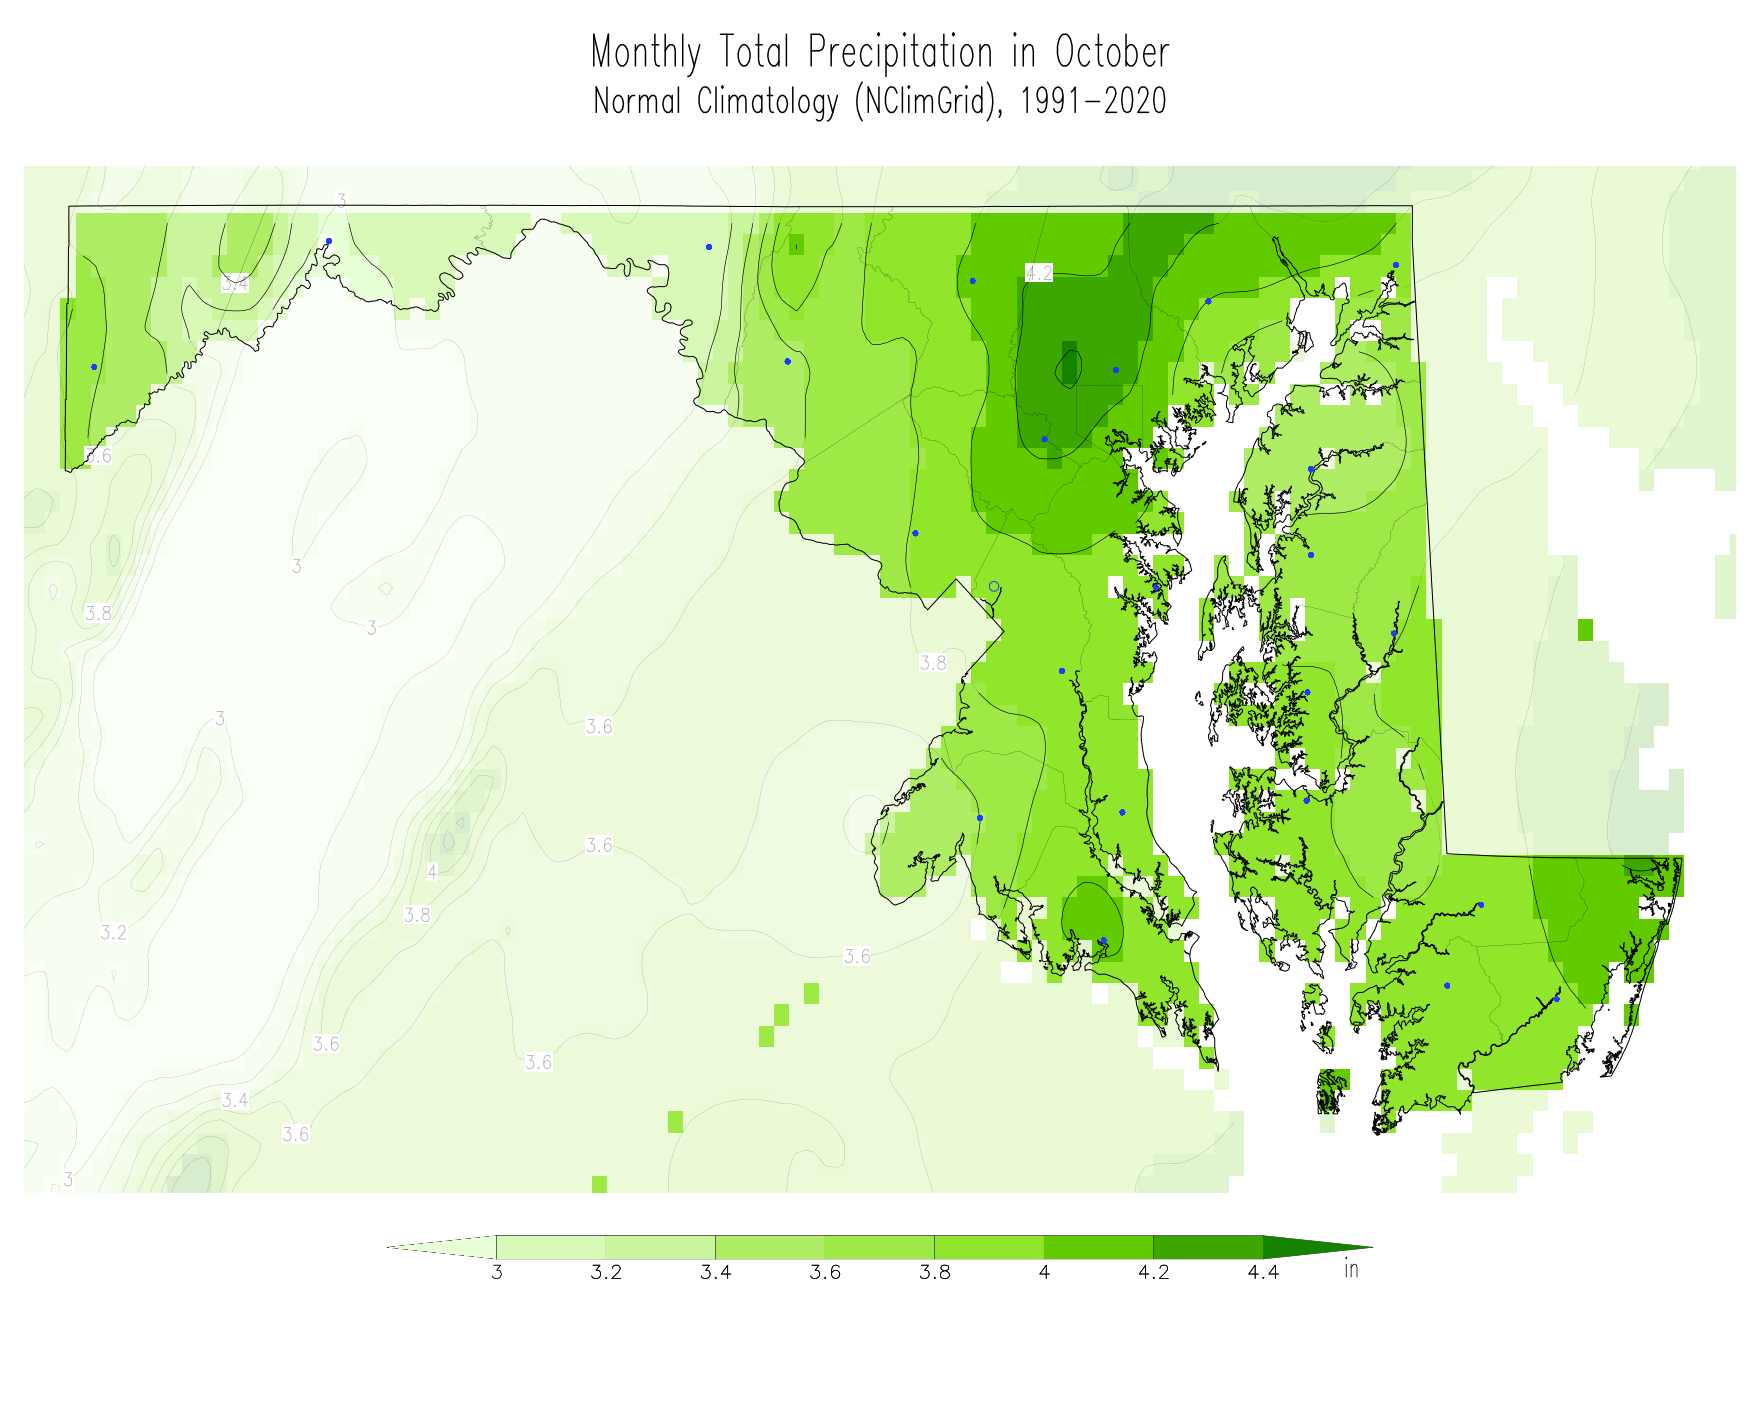
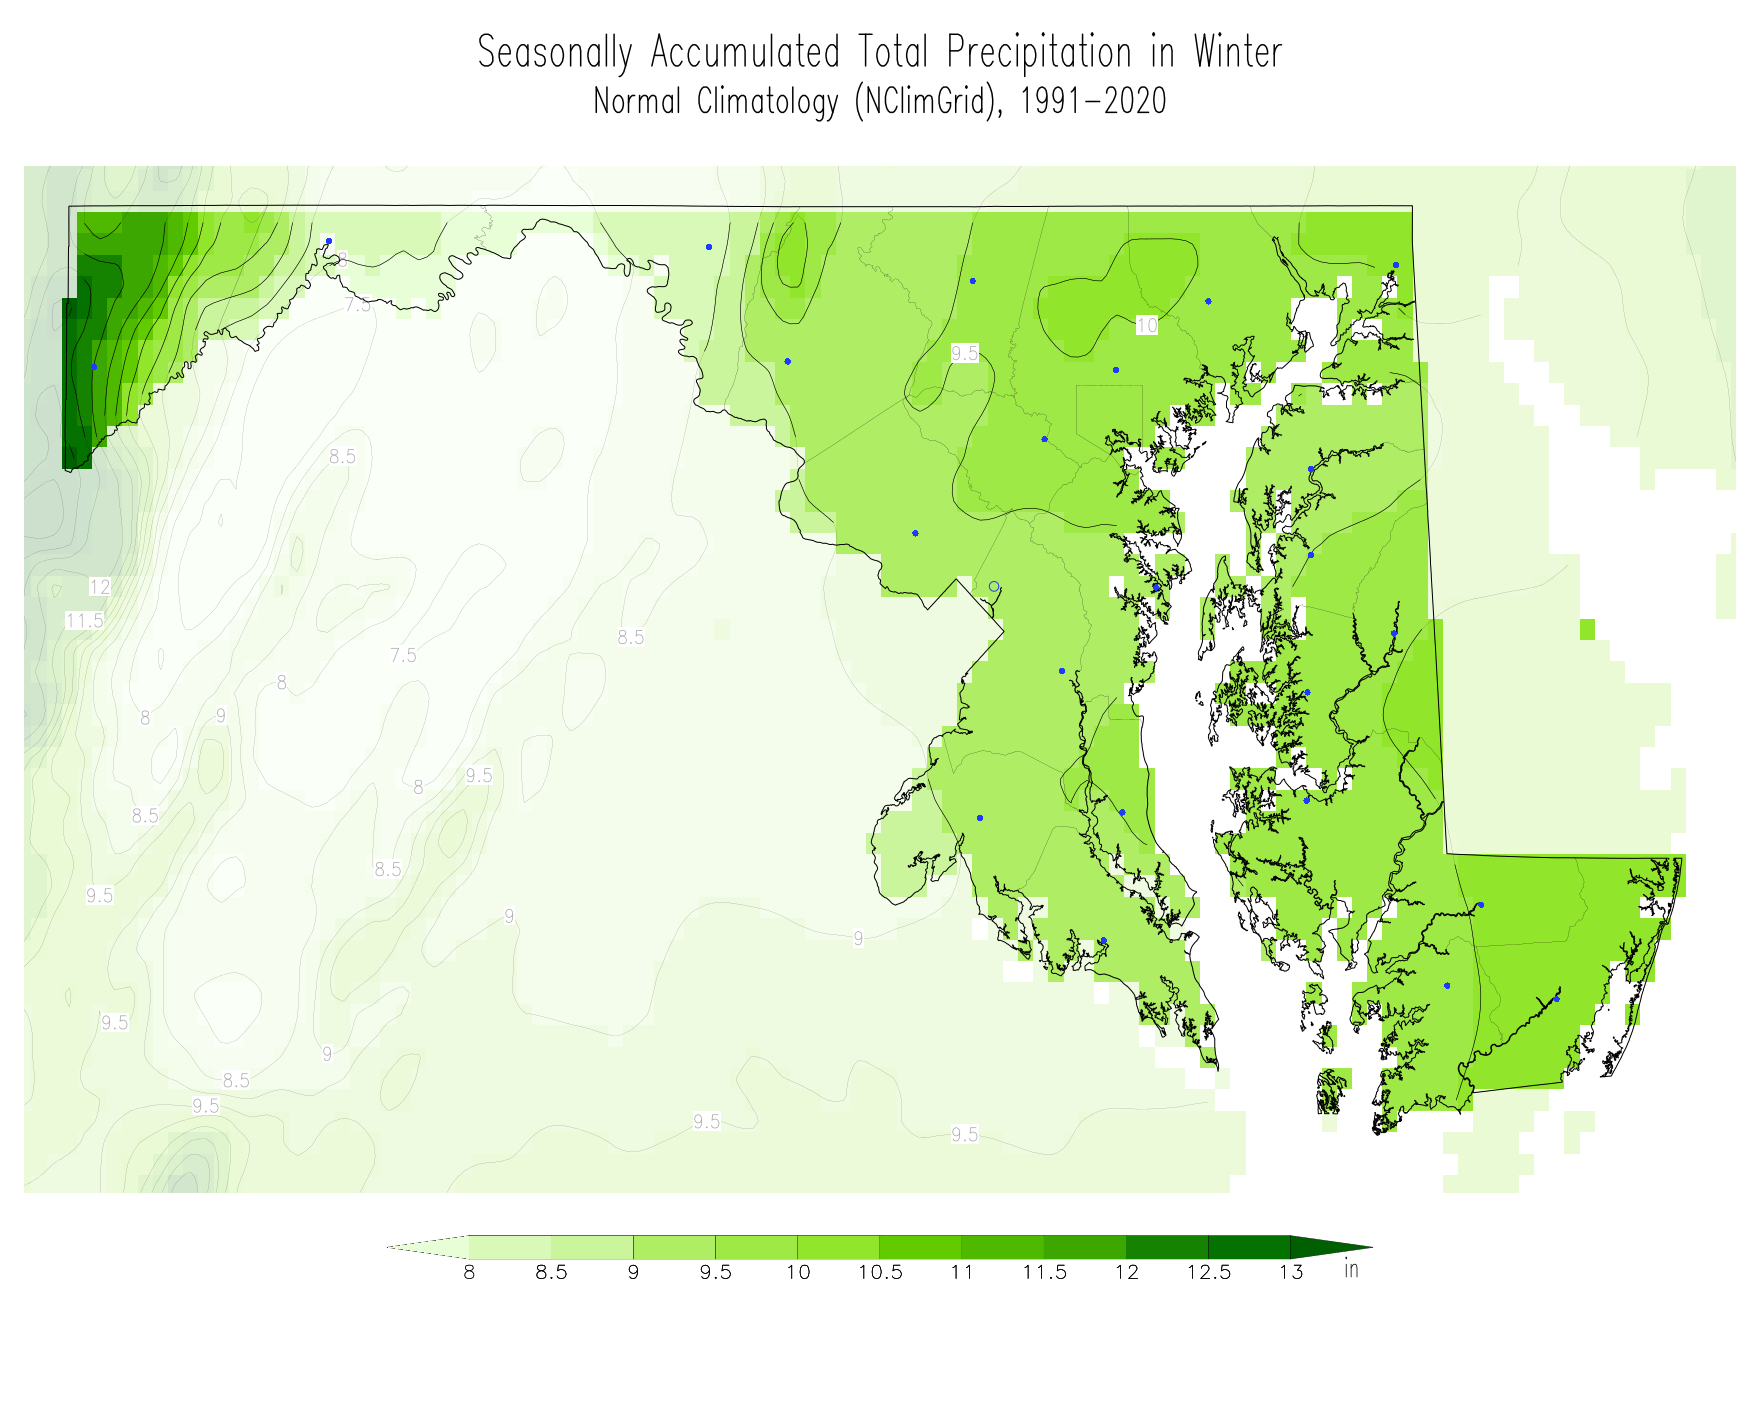
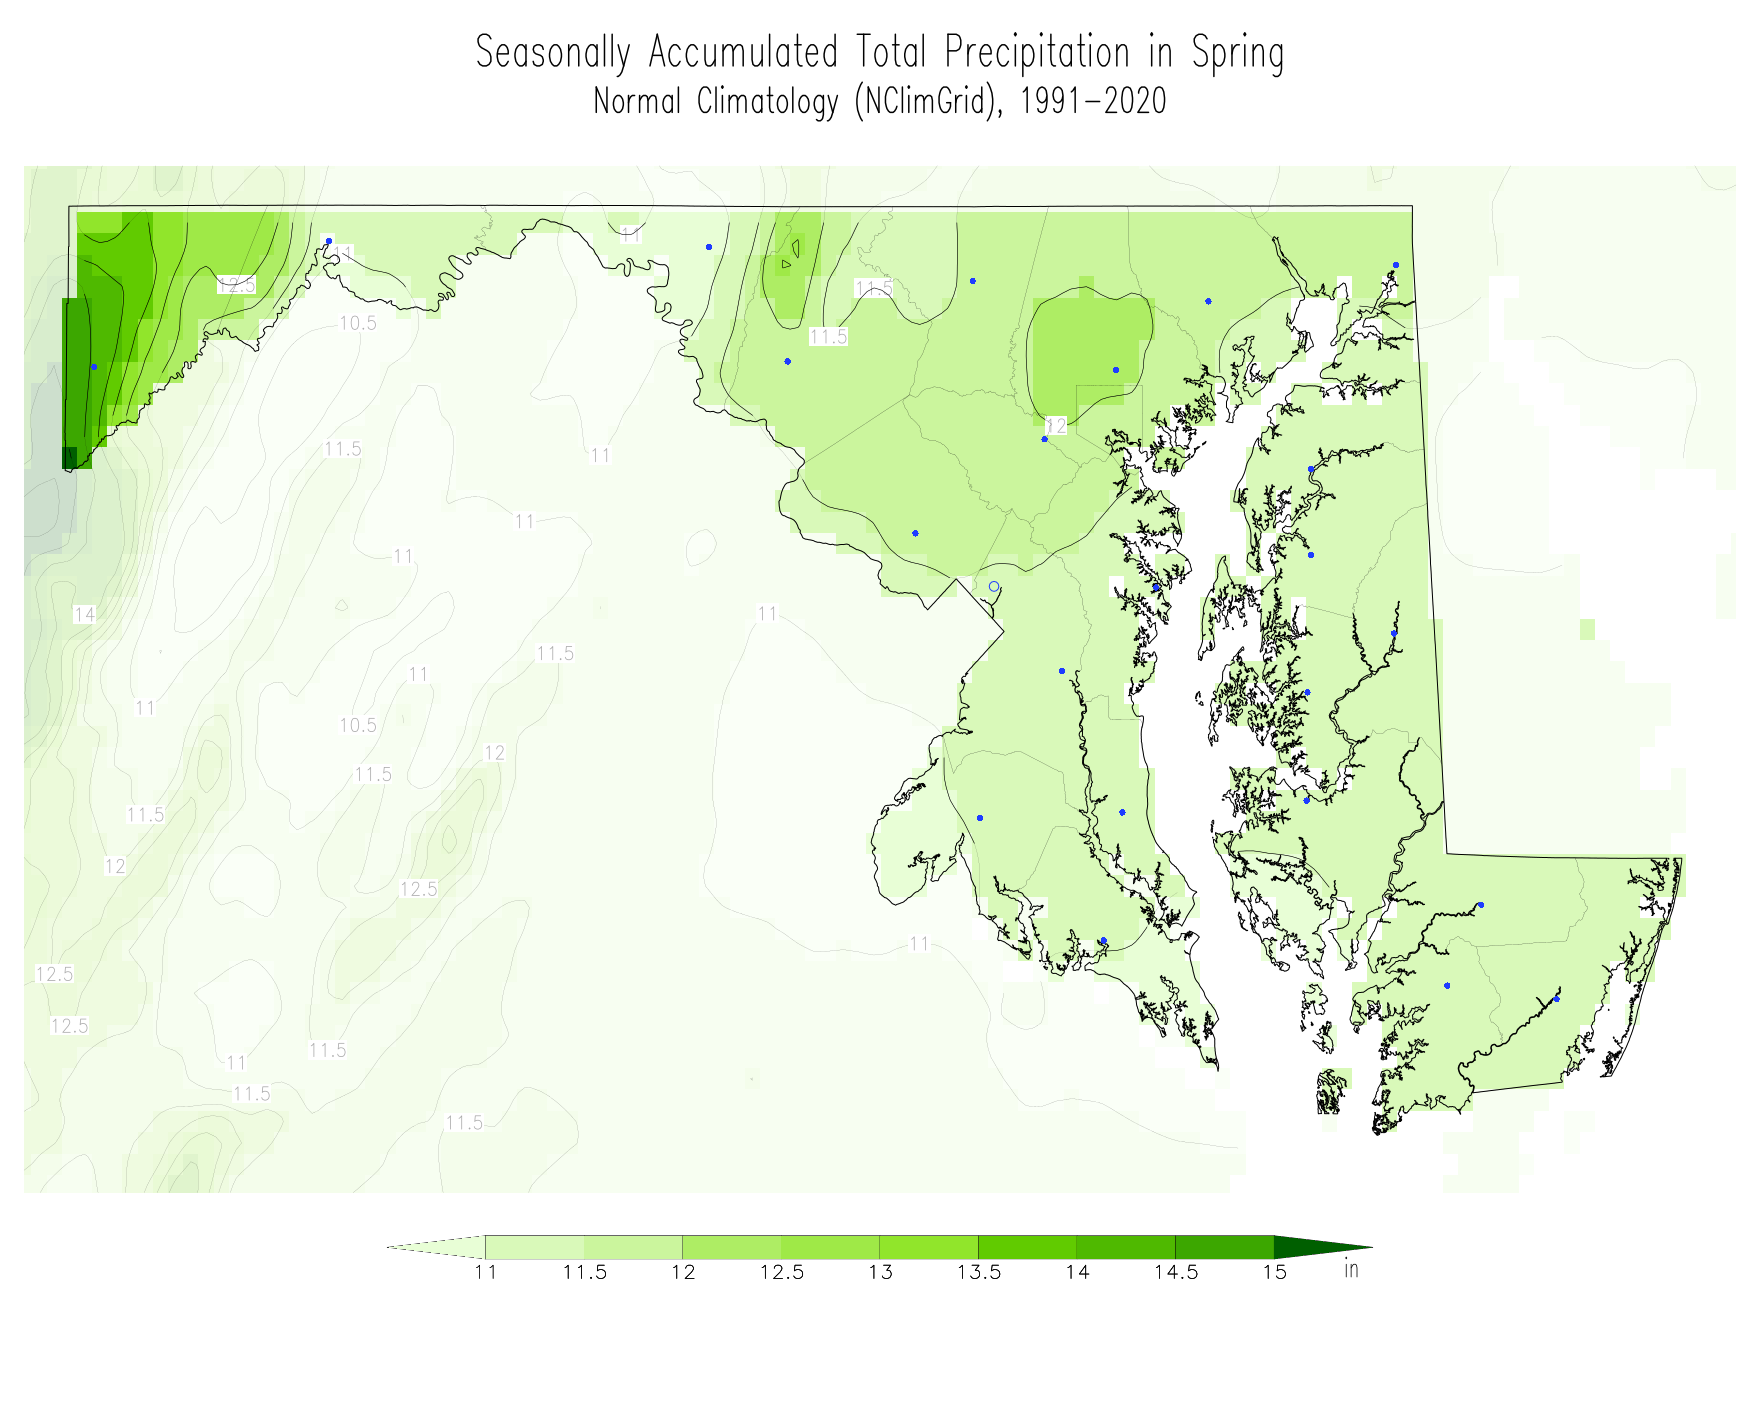
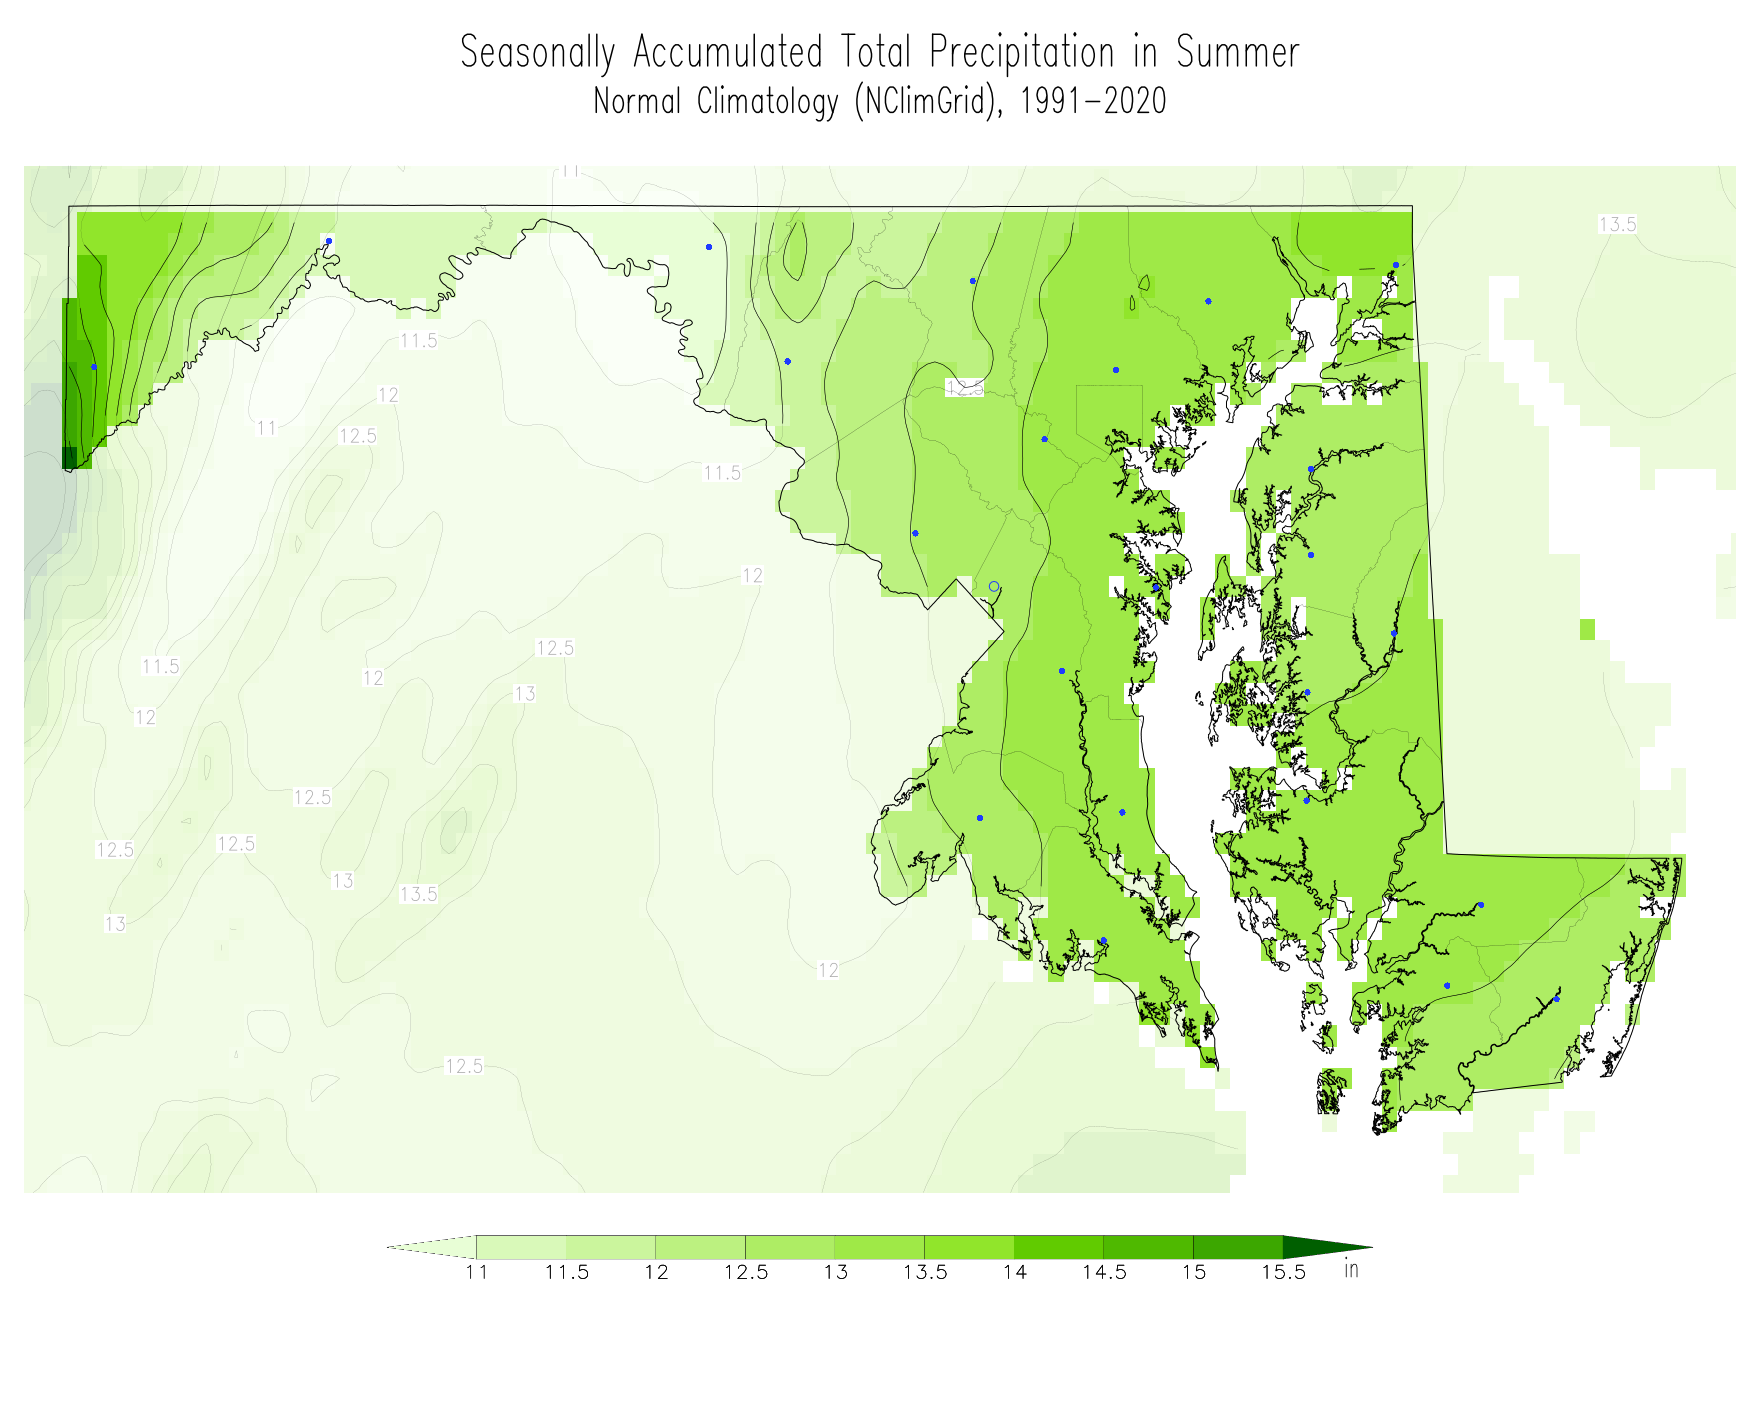
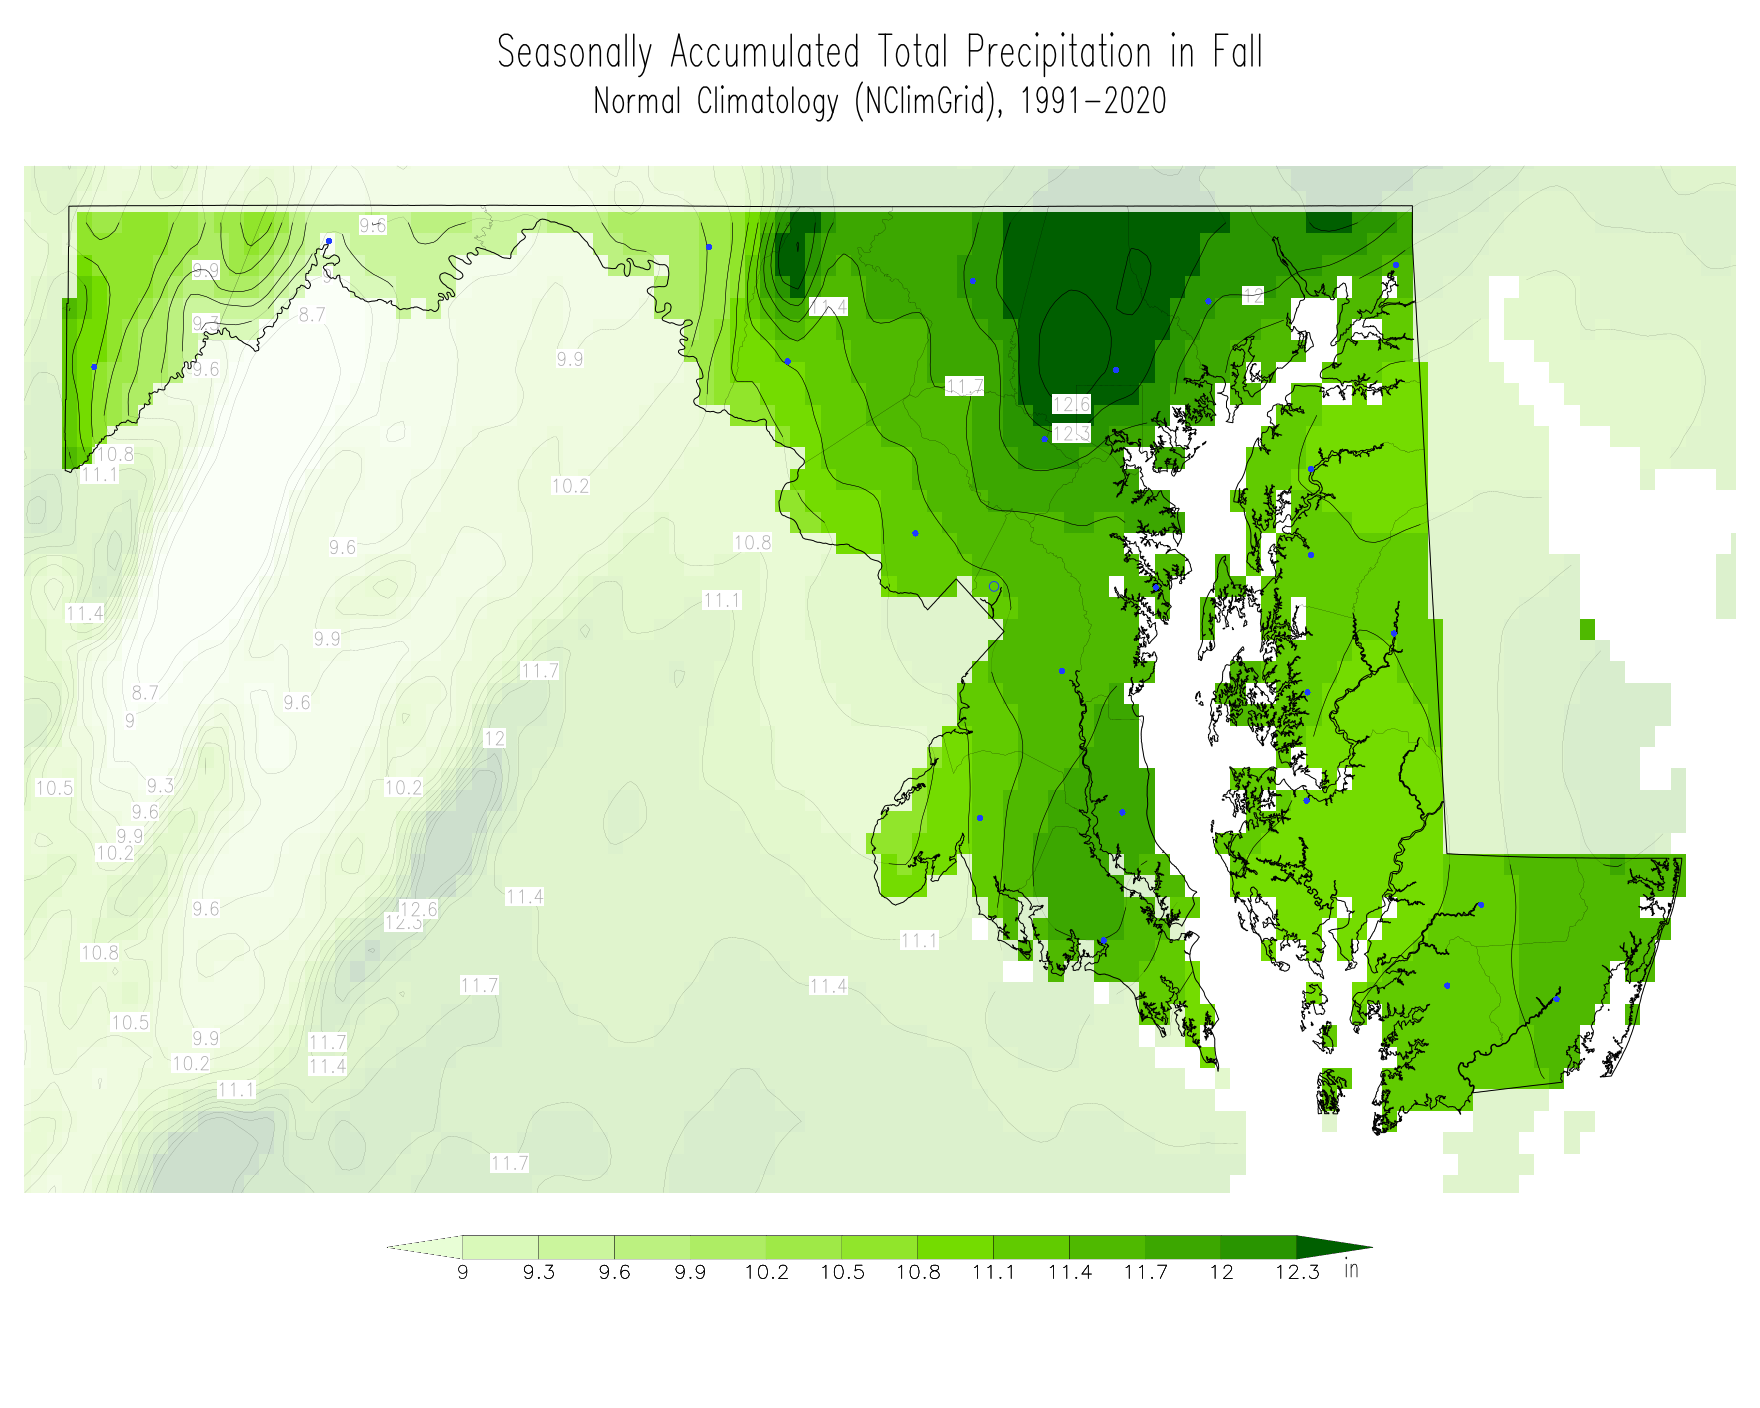
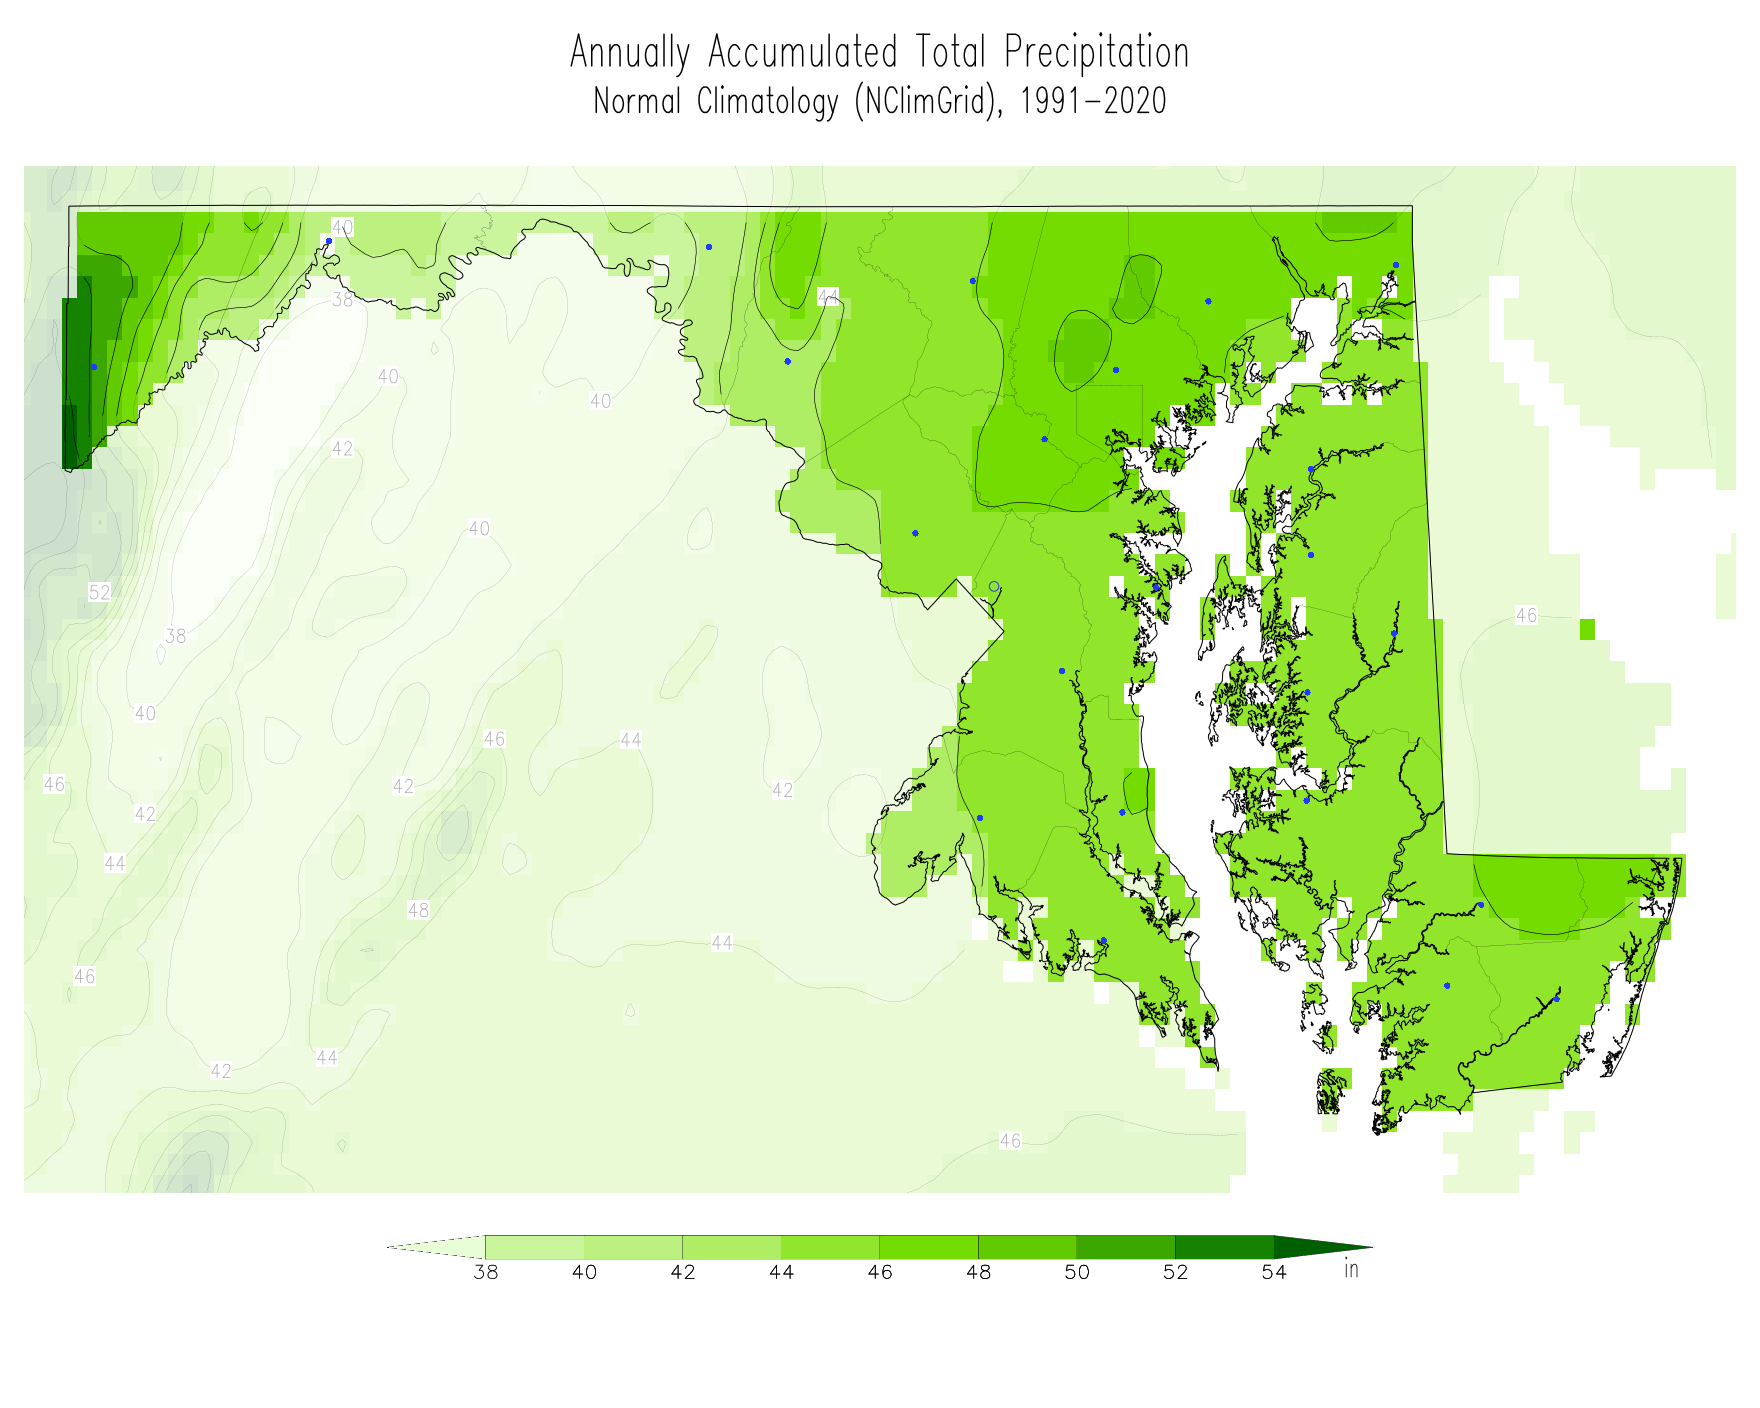
The following maps display the current climatology at monthly, seasonal and annual resolutions for accumulated precipitation. Seasons are defined following the common three-month meteorological definitions: March, April, and May for spring; June, July, and August for summer; September, October, and November for fall; and December, January, and February for winter. Seasonal precipitation is obtained as the sum of precipitation in the three months. Annual precipitation is obtained from the 12-month January to December sum of monthly precipitation.
The following are clickable maps that will display the current climatology for the accumulated precipitation. Note that every map has its own color bar.
Climatological Accumulated Precipitation Maps (inches)
1991-2020
Monthly
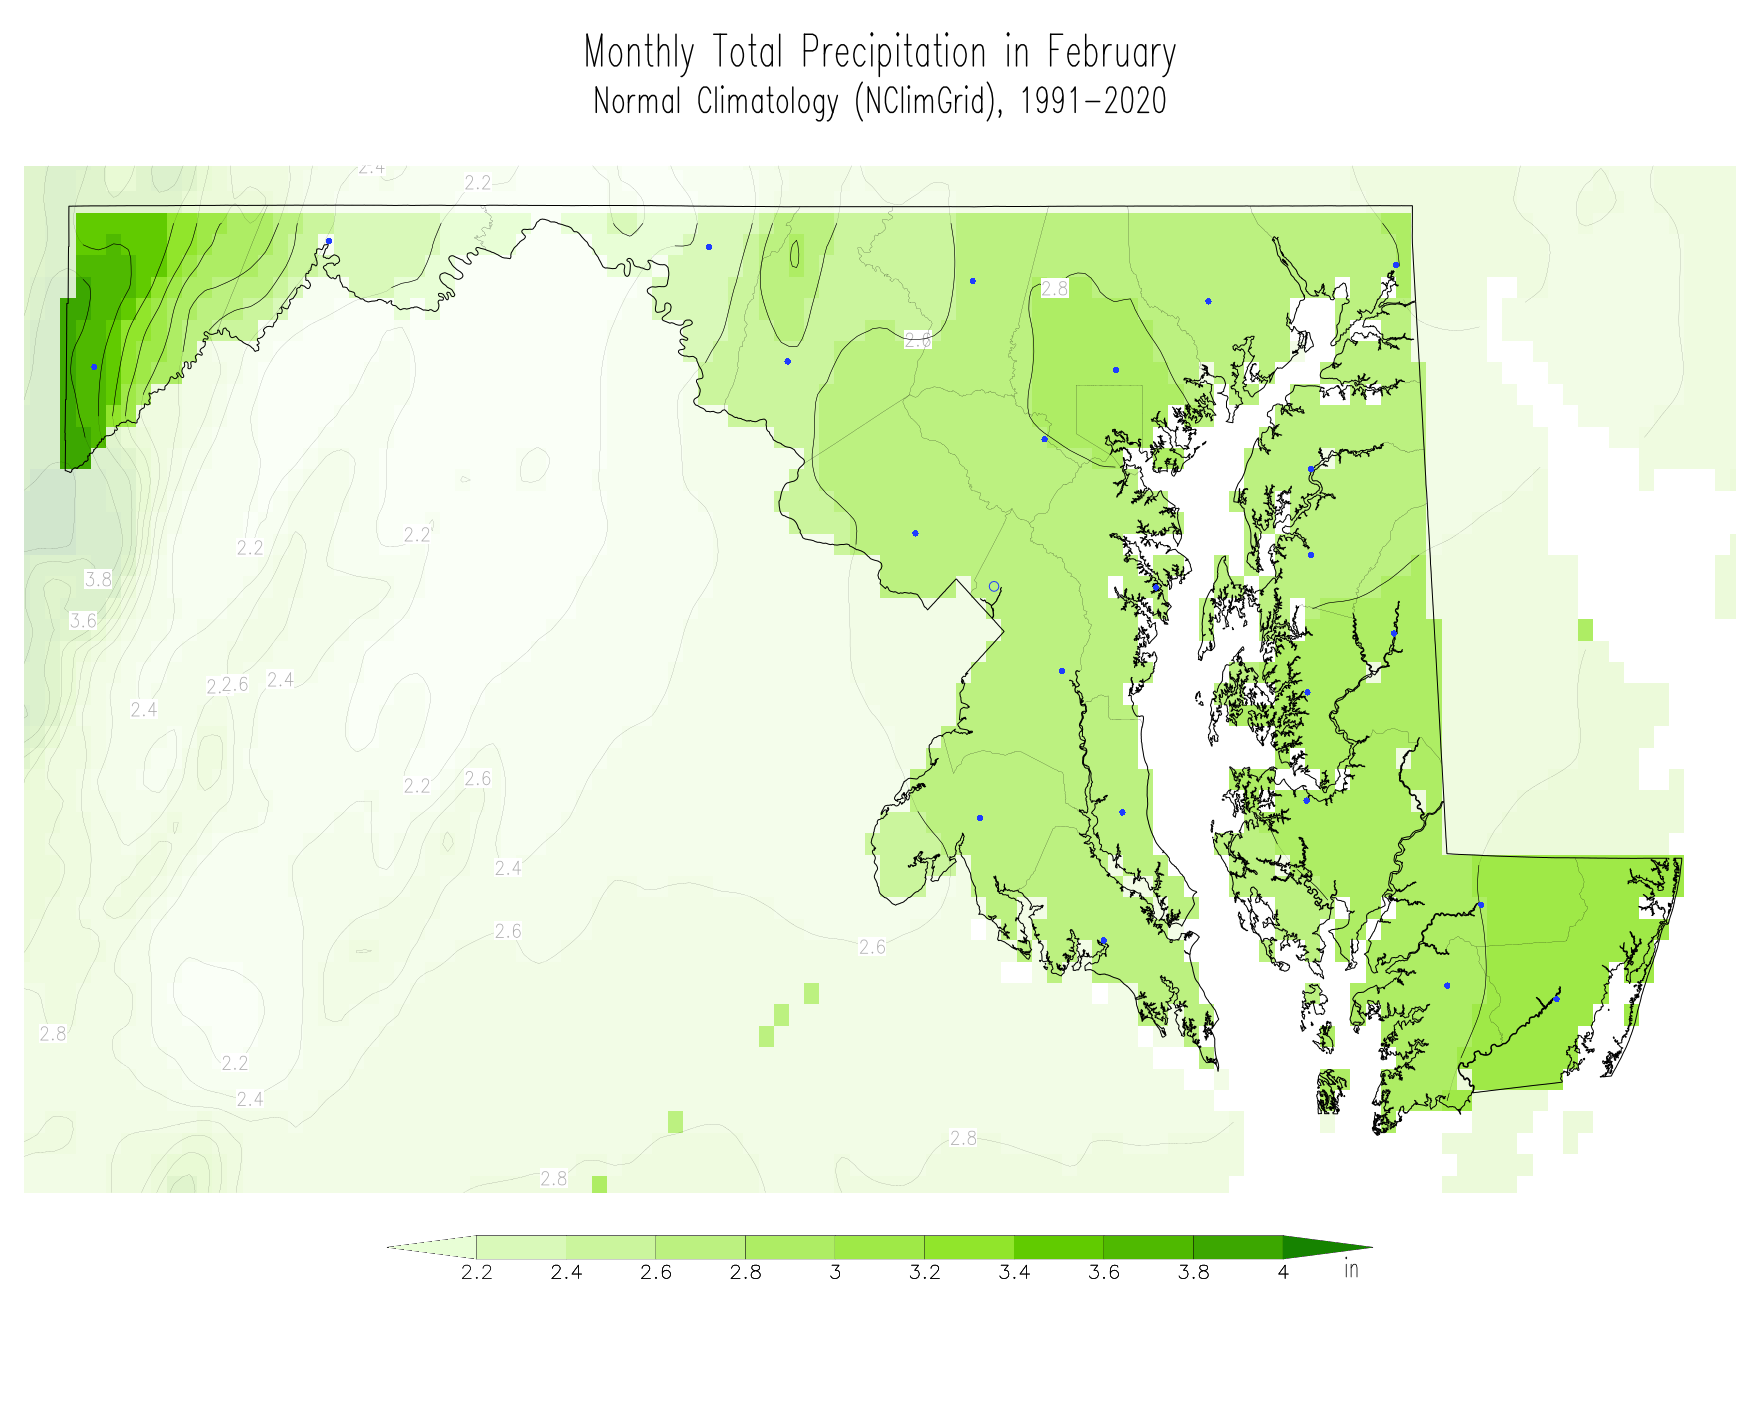
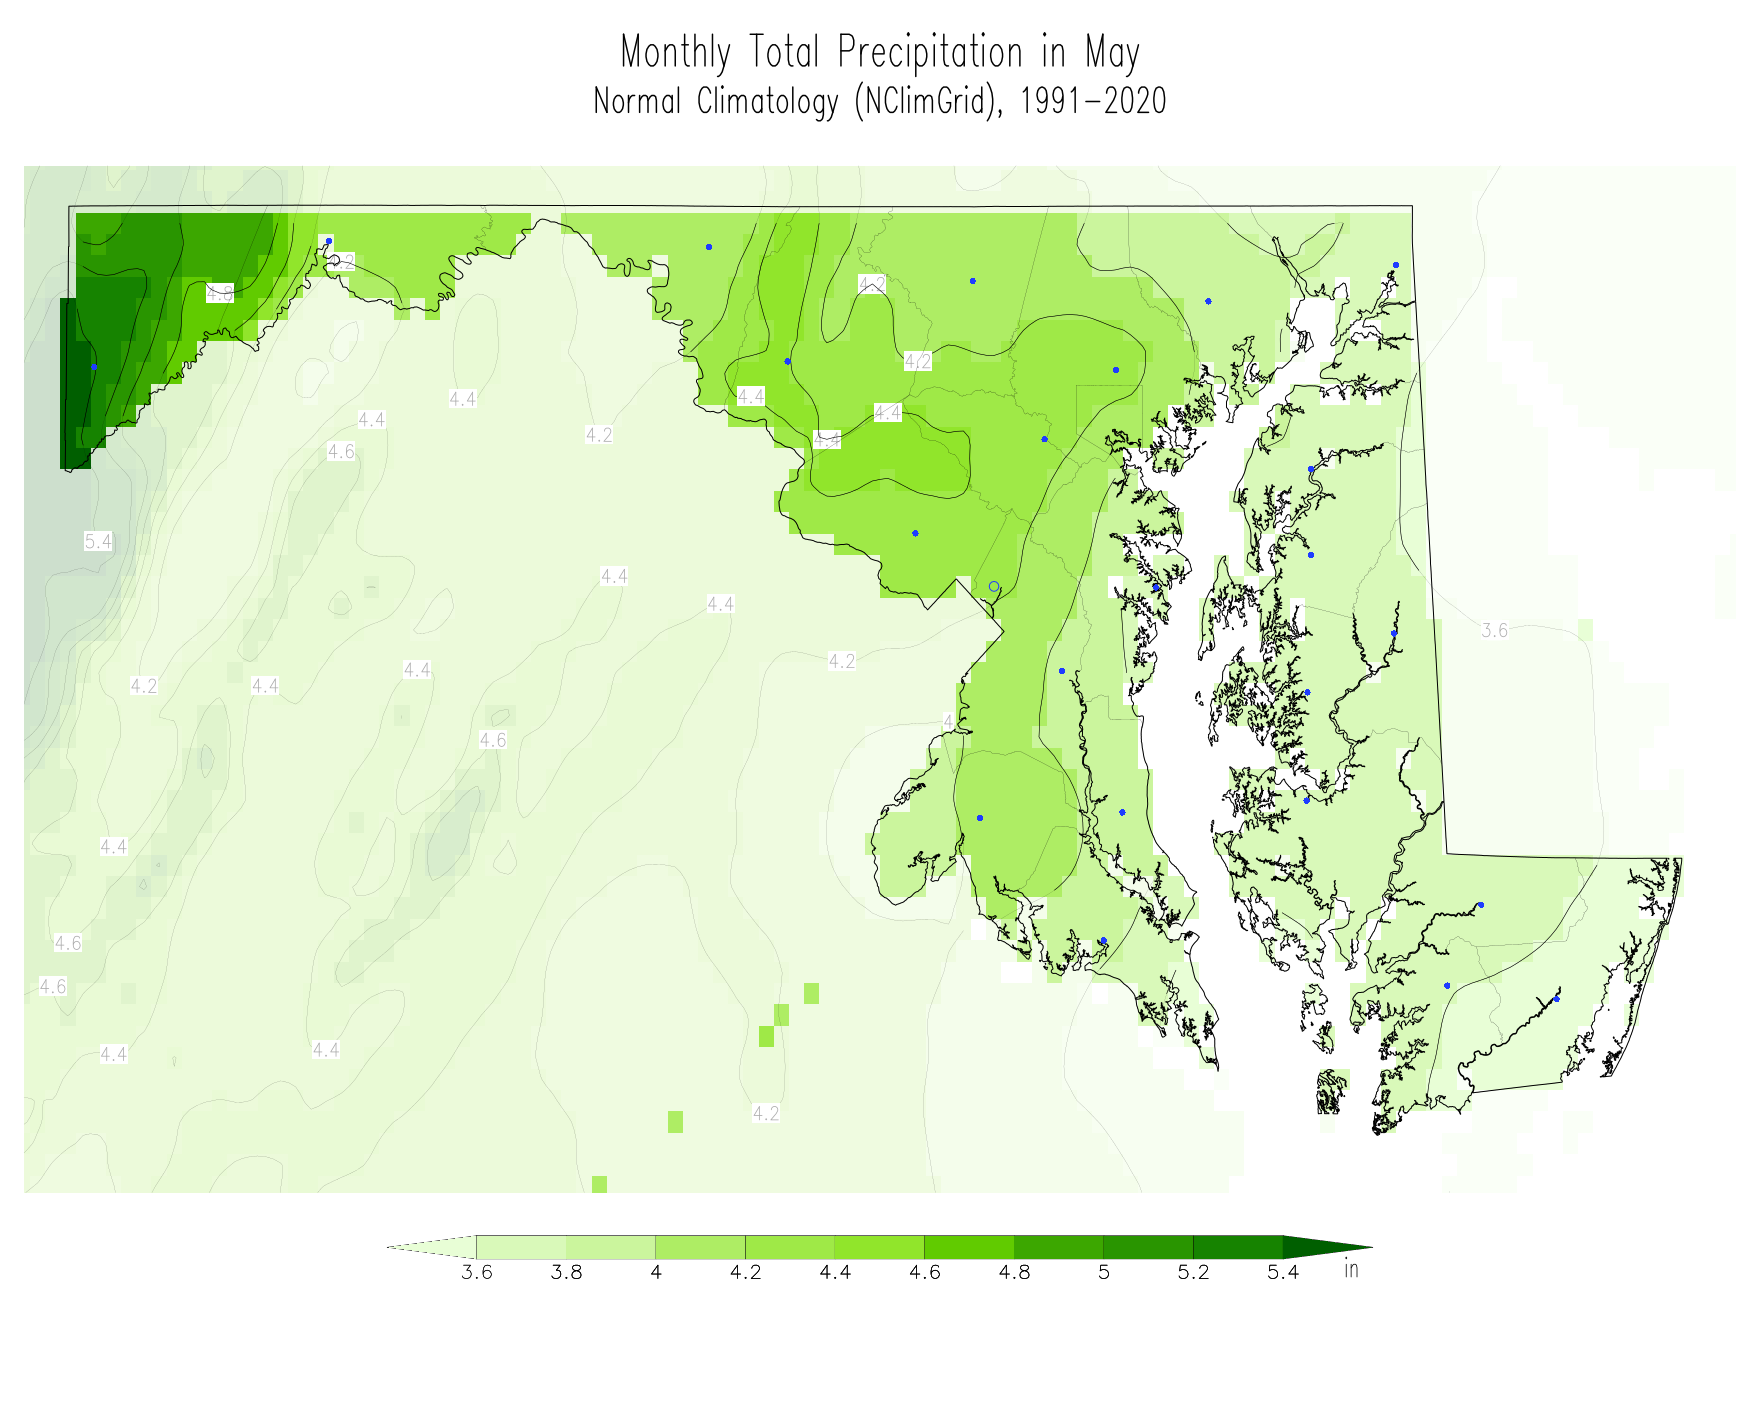
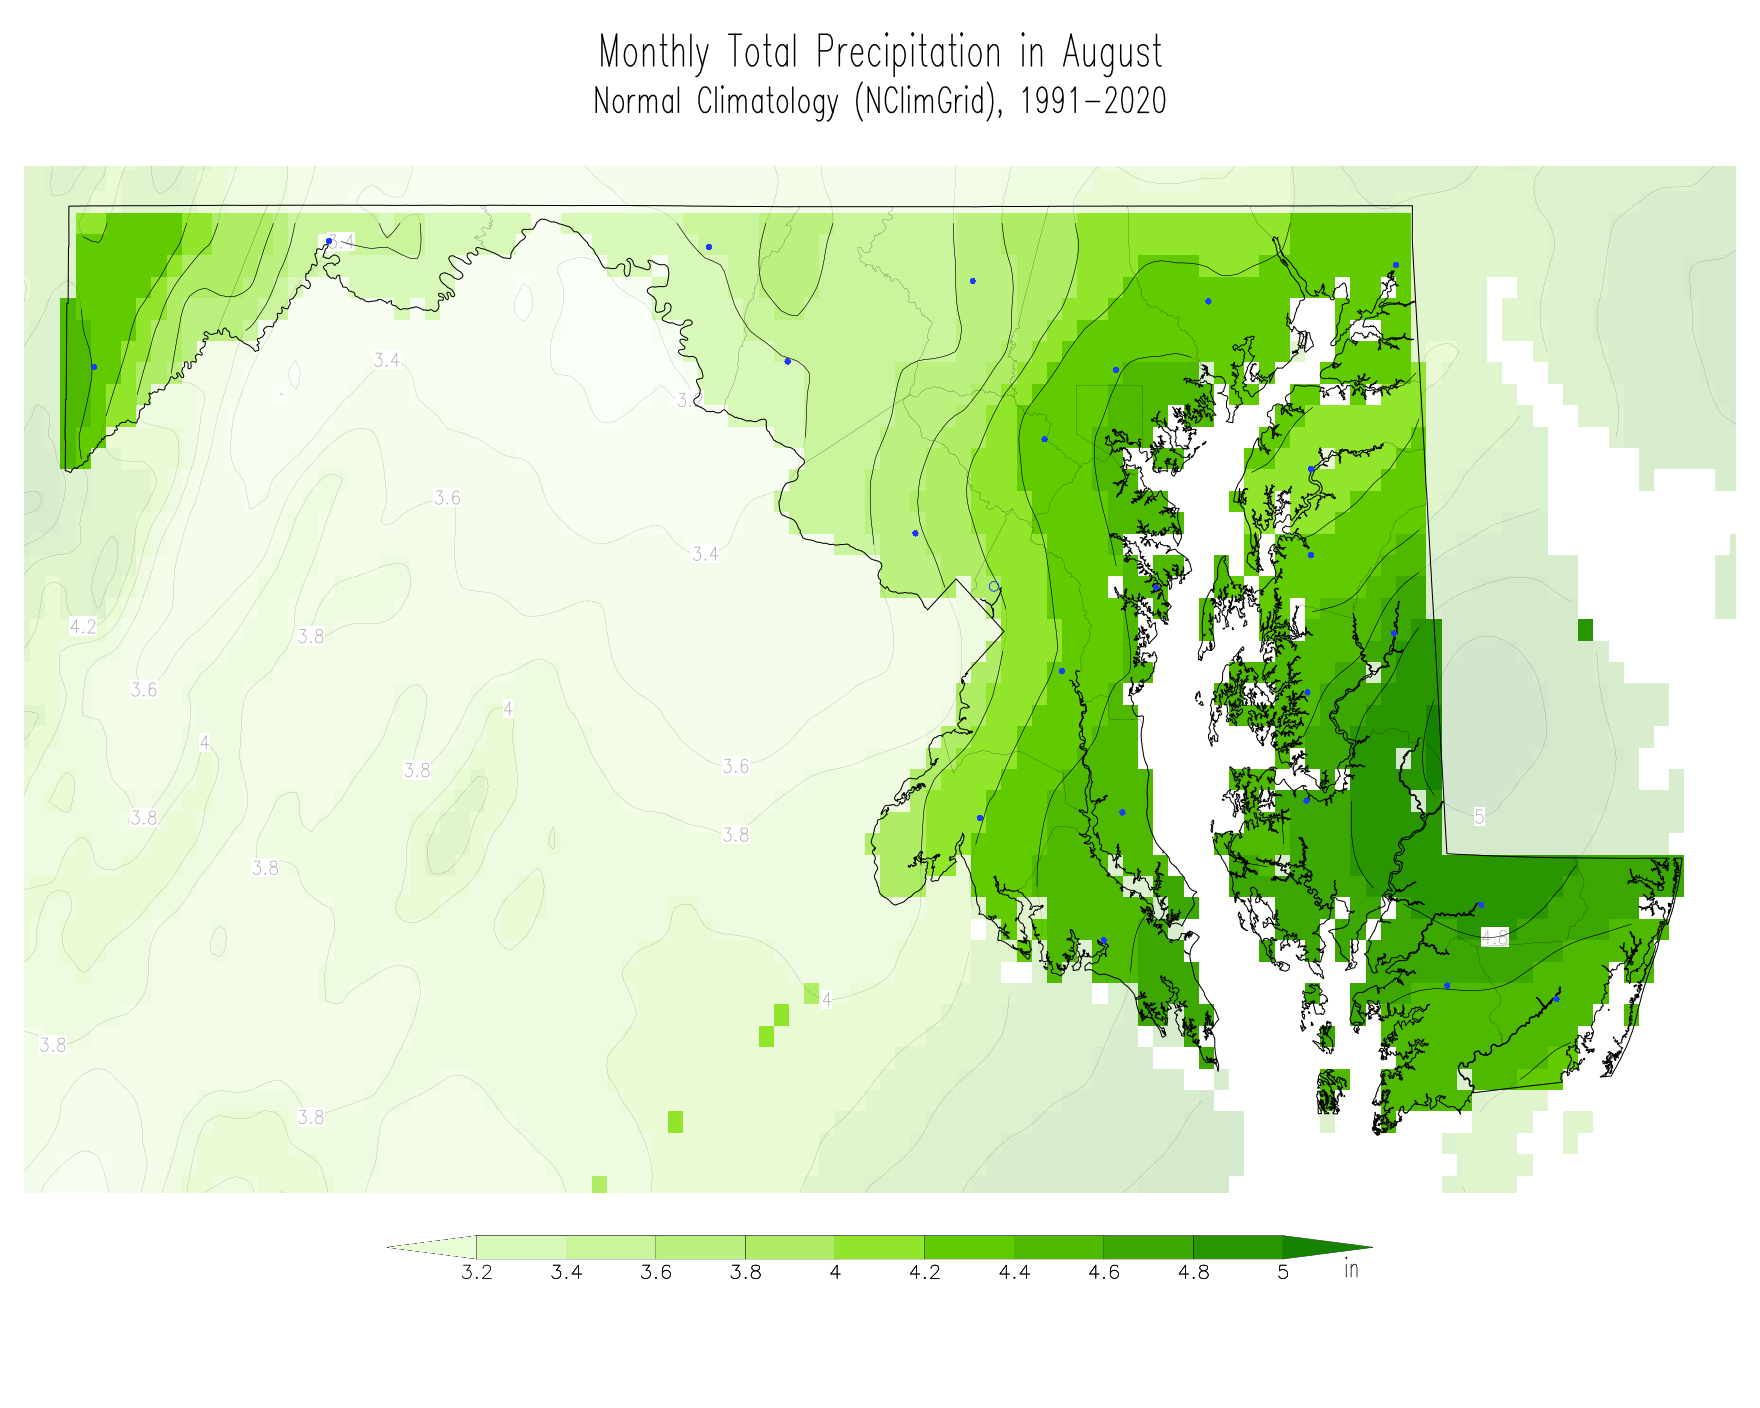
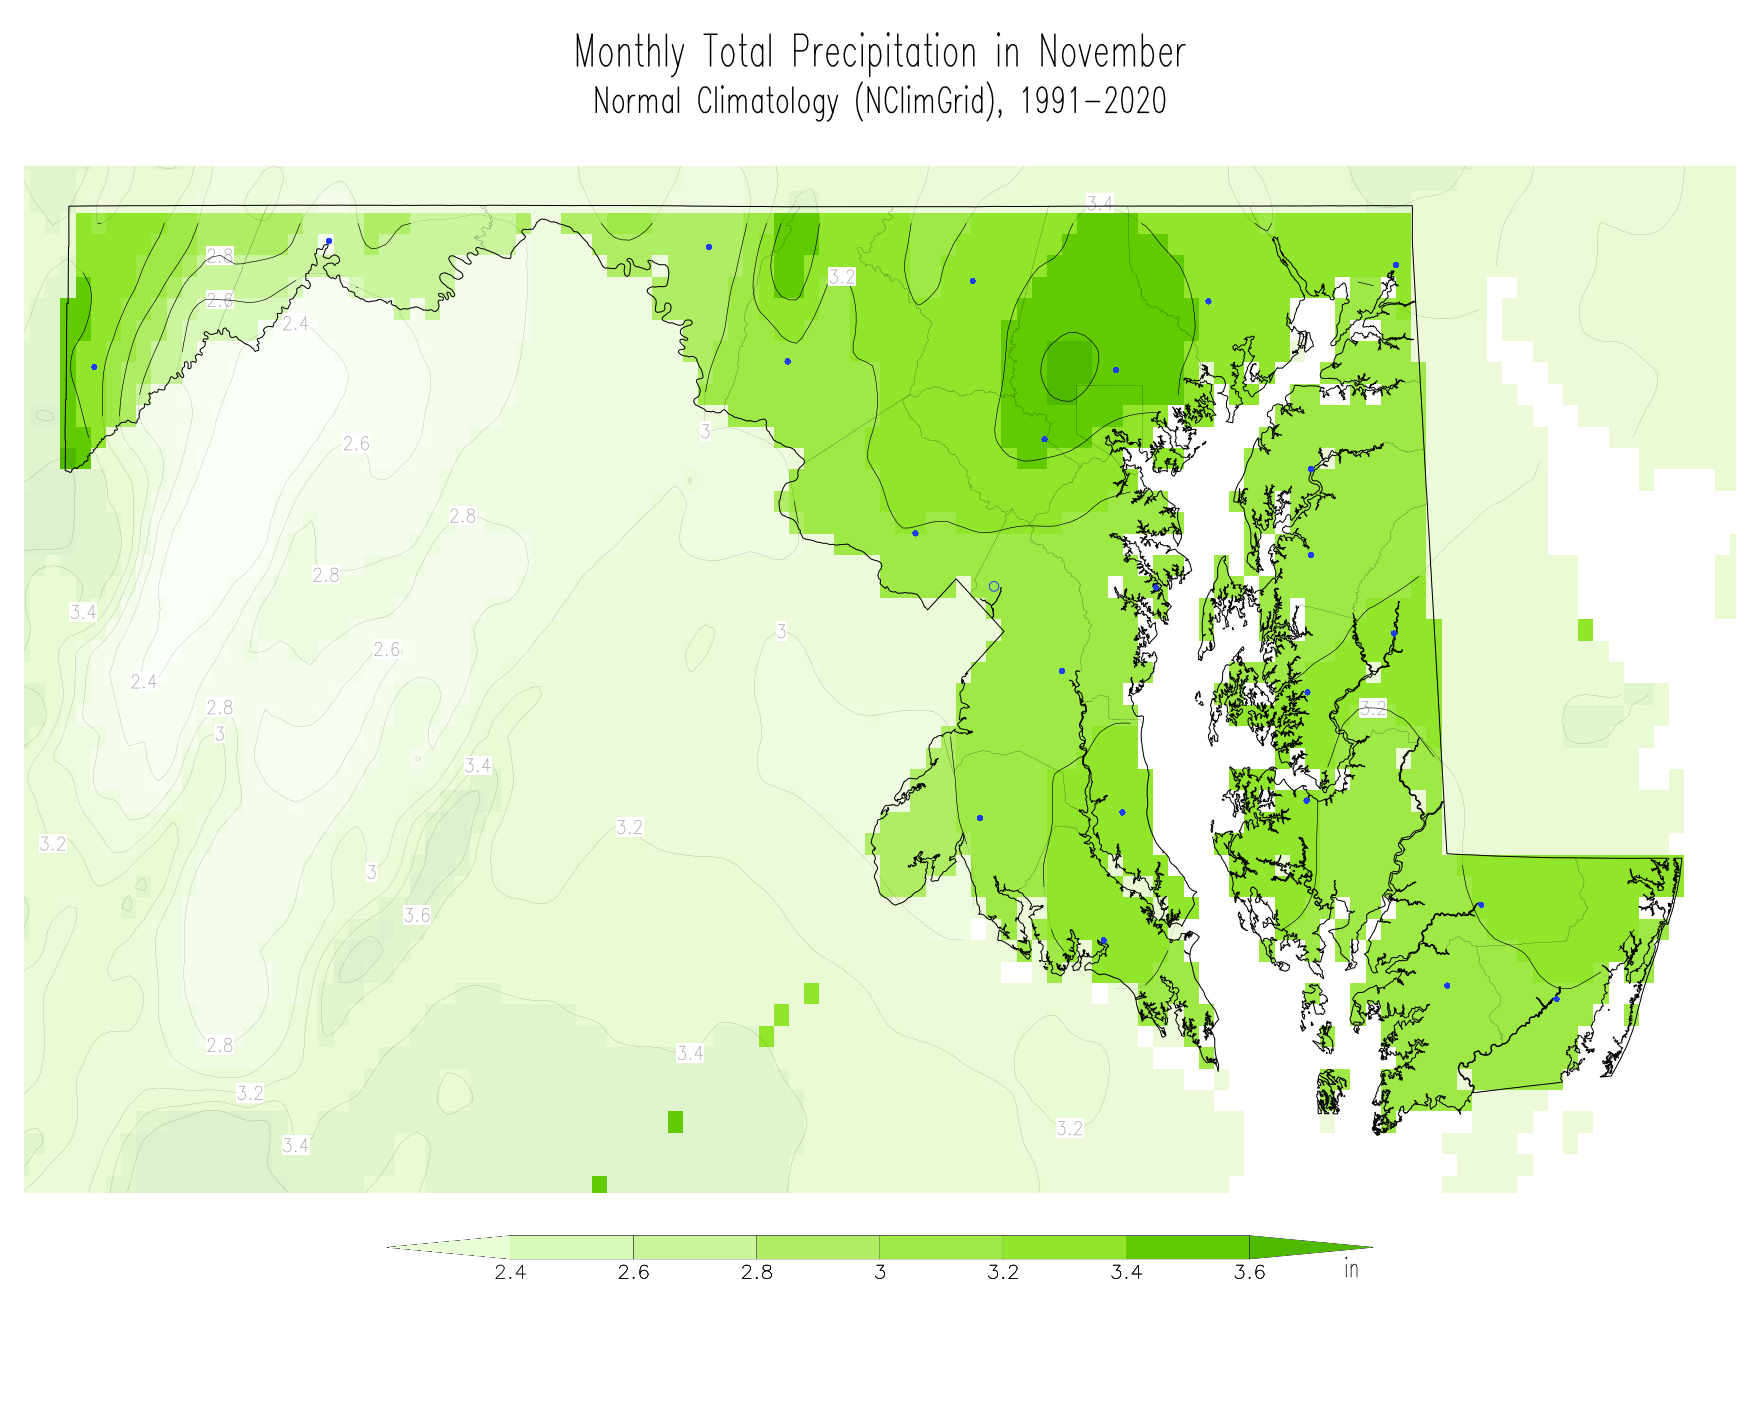
Seasonal
Annual
References