Background
Information
|
|
Forest fire detection
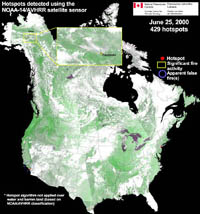
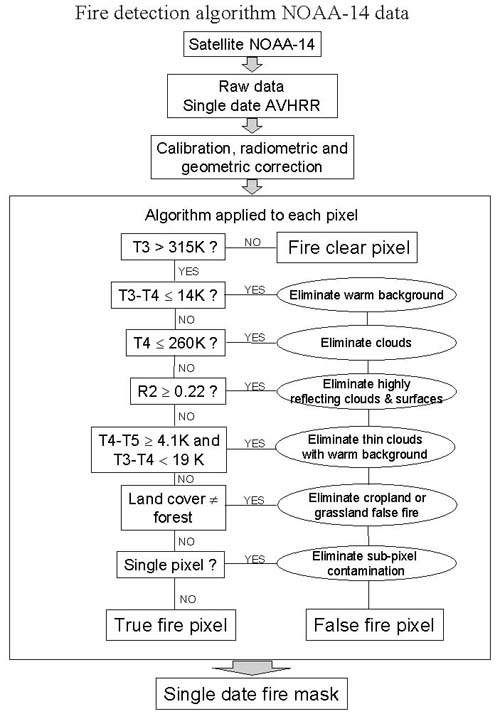
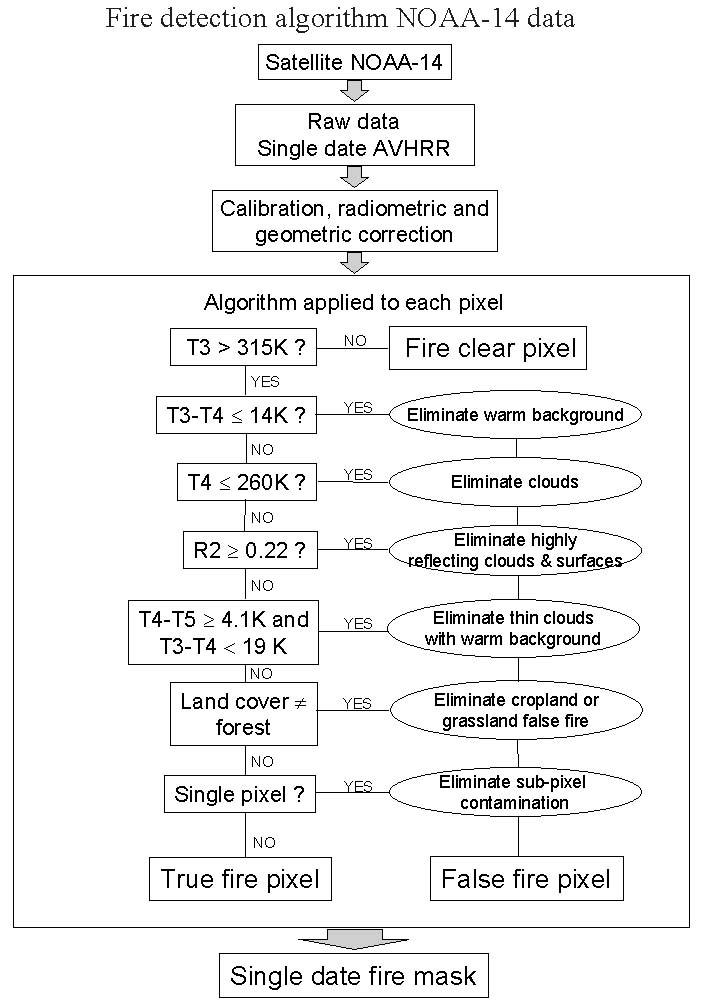
A fire detection (hotspot) algorithm was developed that exploits
the infrared channels (2-5) from AVHRR [7]. The algorithm is based
on the framework of Kaufman et al. [8] with modifications for the NOAA-14/AVHRR
sensor. New tests are also introduced to account for the unique environmental
and wildfire characteristics of boreal forests. The algorithm consists
of two major steps: marking potential fire pixels using the strong thermal
signal in the mid-infrared channel (3.7 ?m), then removing false fires
using a series of threshold tests (Fig.1). Threshold tests were optimised
to detect the majority of real fires, while removing as many false fires
as possible. Thresholds were chosen following a trial-and-error approach
based on a 1,200 by 1,200 km training data set. Histogram analyses
of reflectance and brightness temperature corresponding to burning and
non-burning pixels provided an effective means of obtaining optimised values.
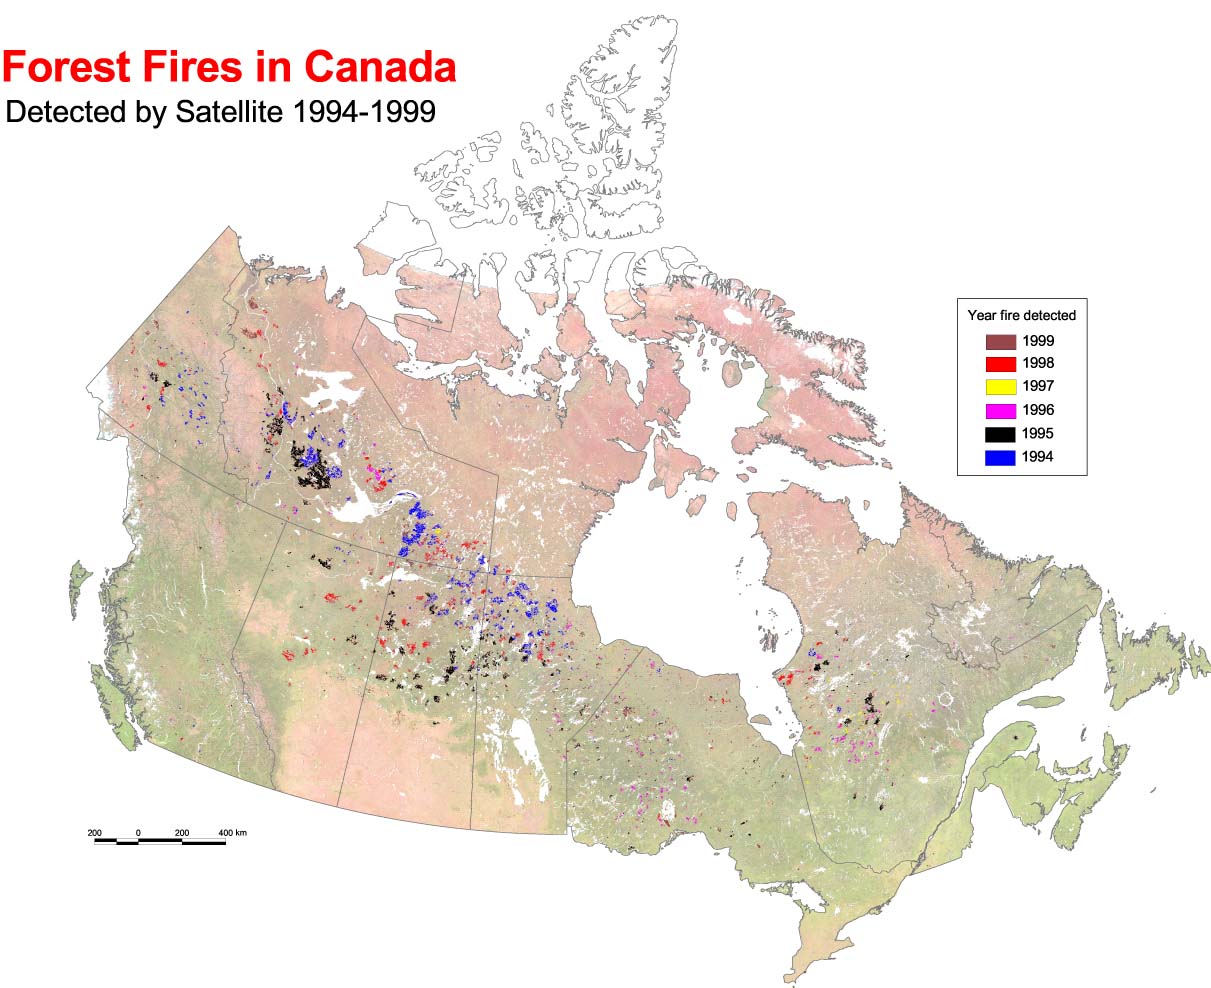
The hotspot algorithm was applied to archived single-date GEOCOMP
composites for the years 1994-1997, producing a daily fire mask for all
of Canada. In summer, 1998, the algorithm was applied operationally.
Images showing active fires and smoke were generated within 24 hours of
satellite reception, and sent to Canadian fire management agencies and
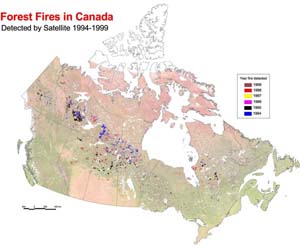
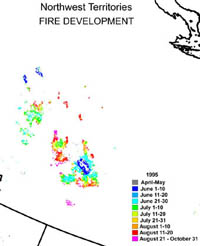
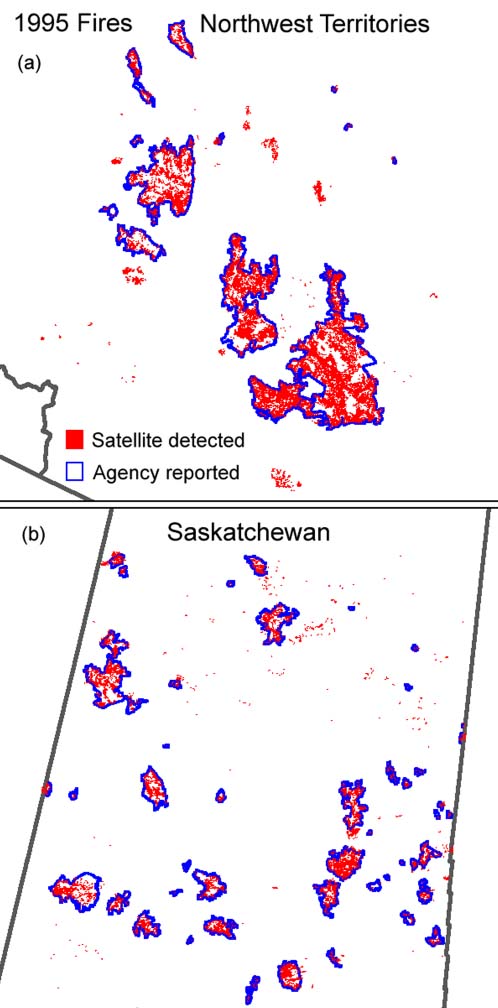
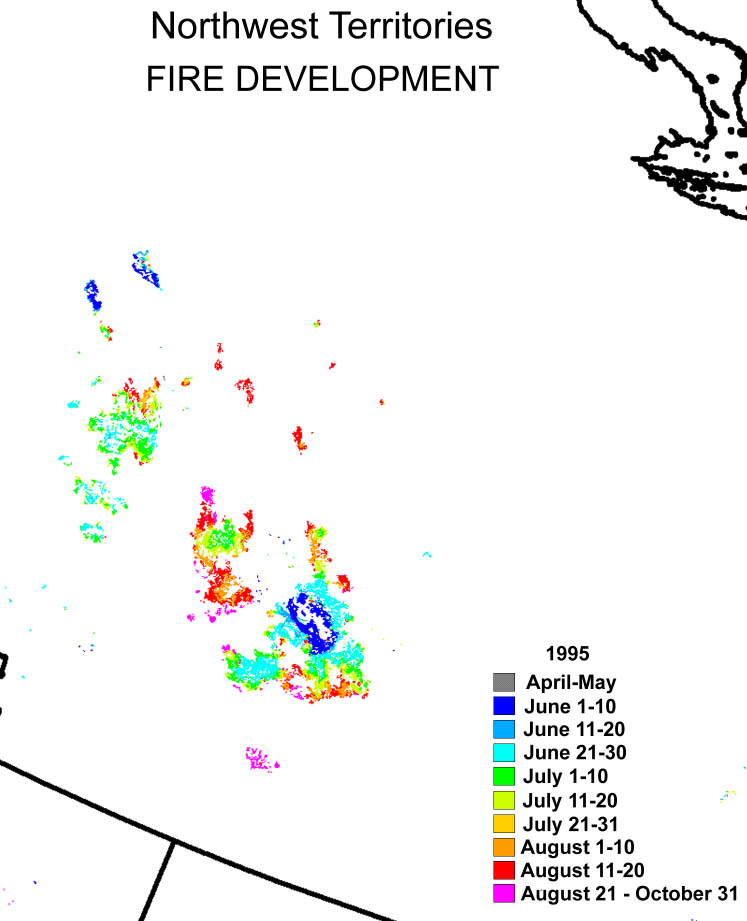
media. Comparing the 1994 and 1995 hotspot locations to provincial
fire surveys, the algorithm was found to detect the vast majority (> 90%)
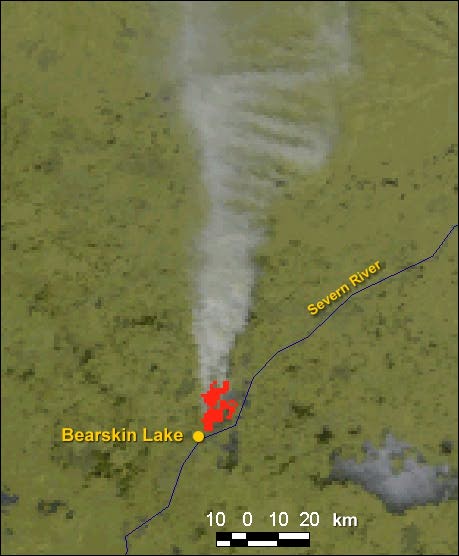
of fires larger than 300 ha. Within individual burns, however, the
distribution of hotspots is patchy due to limited satellite revisit frequency
and obscuring by cloud (Fig. 2). Consequently, the cumulative area
of all hotspot pixels detected during each summer was, on average, about
30% less than estimates based on traditional reconnaissance. To account
for these missed burned patches, a novel burned area mapping technique
was proposed.
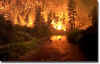 |
Wild fires are a major disturbance to the boreal ecosystem and contribute
to the increase in trace gases that causvariations in climate. Fire also
deplete timber |
resources so that monitoring forest fires is a critical aspect of
sustainable forest management. However, conventional ground-based
fire detection techniques are severely limited because they can only
cover small areas. For a country the size of Canada, a large-area monitoring
capability would provide a definite advantage.
A recent pilot study at CCRS has demonstrated that daily satellite identification
of forest fires across the Canadian landmass is feasible. Researchers in
Environmental Monitoring have developed preliminary algorithms using NOAA/AVHRR
data to measure forest fires. Active fires are primarily detected using
AVHRR channel 3, while extinguished fires are assessed using the 10-day
clear-sky composites of AVHRR channels 1 and 2. The performance of the
remote sensing algorithms was evaluated against ground-based fire observation
data obtained by provincial fire agencies in Saskatchewan and Manitoba.
The test site, which is the study region of the Boreal Ecosystem-Atmosphere
Study (BOREAS), spans an area of 1000 X 1000 km2 across the two provinces.
During the 1994 fire season, about 70 fires were observed over the study
site: ground observations reported 76 and satellite observations reported
66. The difference in reporting is due largely to the ambiguity created
by fire clustering. The total burning area estimated by the two approaches
is around 1.8 and 1.9 million hectares. Statistics for the bulk size of
fires are
comparable for both ground and satellite observations, but comparison
is poor for the size of individual fires. The satellite-based technique
monitors the evolution of each fire fairly well, within the limitations
imposed by cloud cover and generally reports the starting dates of fires
earlier than those reported by ground observations. This provides a better
opportunity to suppress the fires before they run out of control.
Based on these promising early results, developing a space-borne operational
system for nation-wide fire monitoring is now possible. Further studies
will provide more timely and complete information on fire and its emissions,
and the interaction between fires and weather.
For more information, please contact:
Zhanqing Li
Applications Division, CCRS


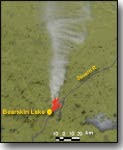
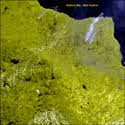
Bearskin Lake, Ontario
Full Image (28kb jpg)
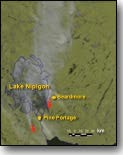
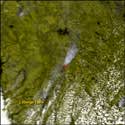
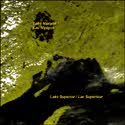
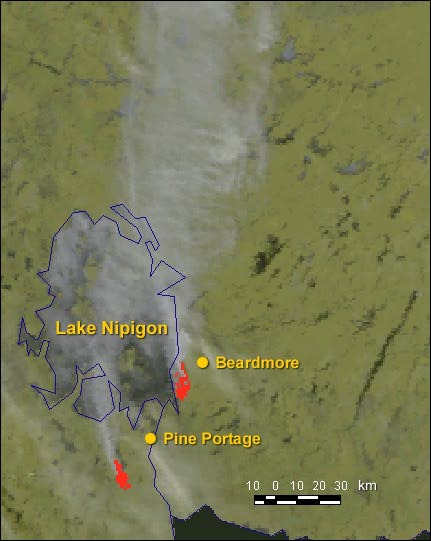
Lake Nipigon, Ontario
Full image (28kb jpg)
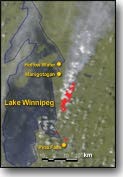
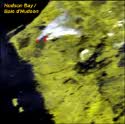
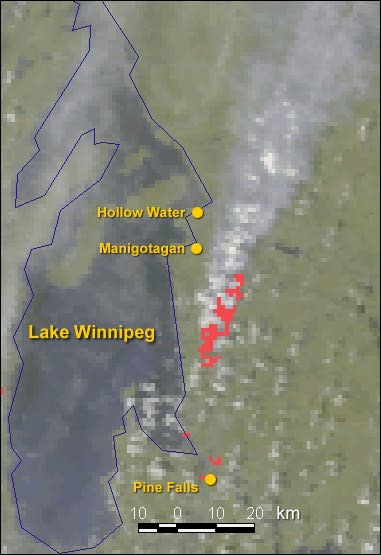
Lake Winnipeg, Manitoba
Full image (28kb jpg)
|
|
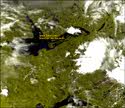
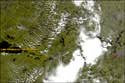
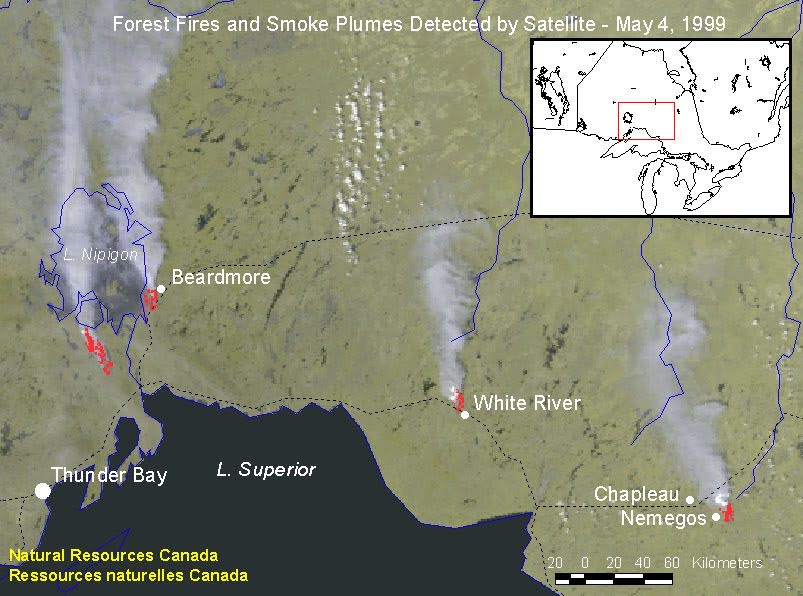
Forest Fires, 1999
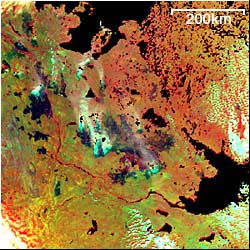
Given the size of Canada, the use of remote sensing data is considered
to be the only cost effective way to achieve a comprehensive overview of
forest fire activity in Canada in near-real time. These images were acquired
as part of the Fire
Monitoring, Mapping and Modeling System (Fire M3) an initiative of
the Canada Centre for Remote Sensing and the Canadian Forest Service.
A dry spring and human carelessness has resulted in more than 65 forest
fires in Manitoba. About 400 residents of three small towns clustered on
the northeast shore of Lake Winnipeg have been forced to flee their homes.
In Northern Ontario, 54 fires broke out over the weekend of May 1, forcing
for a time the closing of highways in the Temagami and Kenora areas. A
huge forest fire has forced the evacuation of the town of Beardmore located
on the southeast shore of Lake Nipigon. About 300 residents from the town
have fled to Geraldton, 80 kilometres to the east.
Sources: Winnipeg Free Press and CBC News online. |
 Kluane
Lake, Yukon Kluane
Lake, Yukon
 Great
Bear Lake, NWT Great
Bear Lake, NWT
 Great
Slave Lake, NWT Great
Slave Lake, NWT
 Kasba
Lake, NWT Kasba
Lake, NWT
 Salmon
Arm, B.C. Salmon
Arm, B.C.
 Williston
Lake, B.C. Williston
Lake, B.C.
 Swan
Hills, Alta. Swan
Hills, Alta.
Lake
Athabasca, Sask.
Reindeer
Lake, Sask.
 S.
Indian Lake, Man. S.
Indian Lake, Man.
James
Bay, Ont.
Lake
Nipigon, Ont.
 James
Bay, Que James
Bay, Que |
|
|
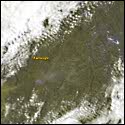
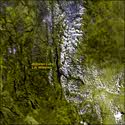
Canadian Forest
Fires, 1998
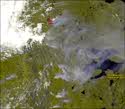
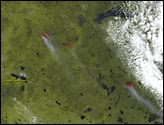
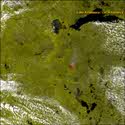
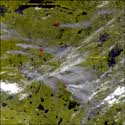
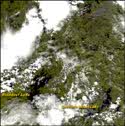
These are time series of NOAA AVHRR satellite images acquired over areas
of Canada that clearly show the extent of forest fires. The hot spot of
a fire is marked as a red dot and the backgroud is a false-color composite
using AVHRR channel 1 (visible) and channel 2 (near IR) reflectance measurements.
AVHRR data are received at the Prince Albert satellite receiving station.
Raw data are sent to CCRS, where they are first calibrated. A fire
detection algorithm, developed by scientists in the Environmental Monitoring
Section is then applied, and the images can now be used by forest fire
management agencies for forest fire monitoring and supression. |
Location
Map (11Kb)
August 20, 1998 (26Kb)
August 17, 1998 (39Kb)
August 16, 1998 (31Kb)
August 15, 1998 (31Kb)
July 20, 1998 (43Kb)
July 5, 1998 (43Kb)
July 4, 1998 (18Kb)
July 3, 1998 (23Kb)
July 3, 1998 (10Kb)
June 6, 1998 (29Kb)
June 2, 1998 (33Kb)
June 1, 1998 (13Kb) |
|
|
 Kluane
Lake, Yukon Kluane
Lake, Yukon
Most recent image - August 20, 1998
(Full resolution, 26kb jpg)
See all thumbnails on one page.
Warning: Can be slow to load. |
Location
Map (14Kb)
August 3, 1998 (67Kb)
August 2, 1998 (63Kb)
August 1, 1998 (62Kb)
July 31, 1998 (52Kb)
July 30, 1998 (42Kb)
July 29, 1998 (19Kb)
July 22, 21:00 hrs
(122Kb)
July 22, 20:00 hrs
(130Kb)
July 21, 22:00 hrs
(21Kb)
July 21, 20:00 hrs
(18Kb)
July 20, 1998 (54Kb)
July 19, 1998 (26Kb)
July 16, 1998 (103Kb)
July 15, 1998 (72Kb)
July 14, 1998 (154Kb)
July 13, 1998 (88Kb)
July 10, 1998 (19Kb)
July 6, 1998 (18Kb)
July 5, 1998 (21Kb)
July 4, 1998 (25Kb) |
|
|
Great
Bear Lake, NWT
Most recent image - August 3, 1998
(Full resolution, 63kb jpg)
See all thumbnails on one page.
Warning: Can be slow to load. |
Location
Map (6Kb)
August 4, 1998 (63Kb)
August 3, 1998 (88Kb)
August 2, 1998 (32Kb)
August 1, 1998 (47Kb)
July 30, 1998 (39Kb)
July 23, 21:00 hrs
(43Kb)
July 23, 19:00 hrs
(50Kb)
July 21, 22:00 hrs
(21Kb)
July 21, 20:00 hrs
(18Kb)
July 19, 1998 (41Kb)
July 18, 1998 (71Kb)
July 17, 1998 (76Kb)
July 15, 1998 (78Kb)
July 12, 1998 (16Kb)
July 11, 1998 (72Kb)
July 10, 1998 (39Kb)
July 9, 1998 (74Kb)
July 8, 1998 (45Kb)
June 25, 1998 (44Kb)
June 9, 1998 (16Kb)
June 7, 1998 (22Kb)
June 6, 1998 (21Kb)
June 5, 1998 (22Kb)
June 4, 1998 (23Kb)
June 3, 1998 (16Kb) |
|
|
Great
Slave Lake, NWT
Most recent image - August 4, 1998
(Full resolution, 63kb jpg)
See all thumbnails on one page. Warning:
Can be slow to load. |
Location
Map (10Kb)
August 22, 1998 (45Kb)
August 18, 1998 (58Kb)
July 26, 1998 (22Kb)
July 24, 1998 (37Kb)
July 7, 1998 (28Kb)
July 5, 1998 (141Kb)
July 4, 1998 (48Kb)
July 3, 1998 (39Kb)
July 2, 1998 (56Kb)
July 1, 1998 (28Kb)
June 30, 1998 (27Kb) |
|
|
Kasba
Lake, NWT
Most recent image - August 22, 1998
(Full resolution, 45kb jpg)
See all thumbnails on one page. Warning:
Can be slow to load. |
|
|
|
Salmon
Arm, B.C.
Most recent image - September 7, 1998
(Full resolution, 49kb jpg)
See all thumbnails on one page. Warning:
Can be slow to load. |
|
|
|
Williston
Lake, B.C.
Most recent image - August 2, 1998
(Full resolution, 58kb jpg)
See all thumbnails on one page. Warning:
Can be slow to load. |
Location
Map (13Kb)
August 31, 1998 (78Kb)
August 30, 1998 (61Kb)
August 22, 1998 (35Kb)
August 20, 1998 (36Kb)
August 18, 1998 (35Kb)
August 14, 1998 (29Kb)
August 13, 1998 (39Kb)
August 12, 1998 (55Kb)
August 11, 1998 (55Kb)
August 10, 1998 (88Kb)
August 9, 1998 (68Kb)
August 8, 1998 (78Kb)
August 7, 1998 (15Kb)
May 30, 1998 (16Kb)
May 26, 1998 (26Kb)
May 25, 1998 (24Kb)
May 24, 1998 (54Kb)
May 22, 1998 (18Kb)
May 22 - RADARSAT (18Kb)
May 21, 1998 (21Kb)
May 19, 1998 (16Kb)
May 18, 1998 (21Kb)
May 17, 22:00 hrs
(25Kb)
May 17, 20:00 hrs
(23Kb)
May 16, 1998 (18Kb)
May 15, 1998 (18Kb)
May 14, 1998 (25Kb)
May 13, 1998 (29Kb)
May 12, 1998 (22Kb)
May 11, 1998 (27Kb)
May 10, 1998 (20Kb)
May 7, 1998 (24Kb)
May 6, 1998 (24Kb)
May 4, 1998 (23Kb) |
|
|
Swan
Hills, Alberta
Most recent image - August 31, 1998
(Full resolution, 78kb jpg)
See all thumbnails on one page. Warning:
Can be slow to load. |
Location
Map (27Kb)
August 17, 1998 (46Kb)
August 12, 1998 (82Kb)
August 11, 1998 (103Kb)
July 11, 1998 (82Kb)
July 10, 1998 (71Kb)
July 8, 1998 (80Kb)
July 6, 1998 (41Kb)
July 5, 1998 (141Kb)
July 4, 1998 (54Kb)
July 2, 1998 (44Kb)
June 24, 1998 (39Kb)
June 23, 1998 (41Kb)
June 20, 1998 (18Kb)
June 13, 1998 (53Kb)
June 12, 1998 (59Kb)
June 11, 1998 (59Kb)
June 10, 1998 (71Kb)
June 8, 1998 (63Kb)
June 7, 1998 (44Kb)
June 6, 1998 (37Kb)
June 5, 1998 (46Kb)
June 3, 1998 (27Kb)
June 2, 1998 (64Kb)
June 1, 1998 (60Kb)
May 31, 1998 (36Kb)
May 30, 1998 (50Kb)
May 29, 1998 (52Kb)
May 28, 1998 (72Kb)
May 27, 1998 (57Kb) |
|
|
Lake
Athabasca, Saskatchewan
Most recent image - August 17, 1998
(Full resolution, 46kb jpg)
See all thumbnails on one page. Warning:
Can be slow to load. |
|
|
|
Reindeer
Lake, Saskatchewan
Most recent image - August 11, 1998
(Full resolution, 53kb jpg)
See all thumbnails on one page. Warning:
Can be slow to load. |
Location
Map (13Kb)
August 22, 1998 (35Kb)
August 12, 1998 (28Kb)
August 7, 1998 (77Kb)
August 6, 1998 (56Kb)
August 5, 1998 (34Kb)
August 4, 1998 (41Kb)
August 3, 1998 (39Kb)
July 18, 1998 (37Kb)
July 17, 1998 (33Kb)
July 10, 1998 (49Kb)
July 9, 1998 (60Kb)
July 8, 1998 (52Kb)
July 6, 1998 (21Kb)
July 5, 1998 (16Kb)
July 4, 1998 (31Kb)
July 3, 1998 (25Kb)
July 2, 1998 (27Kb)
July 1, 1998 (27Kb)
June 30, 1998 (23Kb)
June 29, 1998 (20Kb)
June 28, 1998 (18Kb) |
|
|
Southern
Indian Lake, Manitoba
Most recent image - August 22, 1998
(Full resolution, 35kb jpg)
See all thumbnails on one page. Warning:
Can be slow to load. |
|
|
|
James
Bay, Ontario
Most recent image - August 7, 1998
(Full resolution, 29kb jpg)
See all thumbnails on one page.
Warning: Can be slow to load. |
|
|
|
Lake
Nipigon, Ontario
Most recent image - August 5, 1998
(Full resolution, 24kb jpg)
See all thumbnails on one page. Warning:
Can be slow to load. |
Location
Map (10Kb)
August 7, 1998 (14Kb)
July 20, 1998 (12Kb)
July 14, 1998 (21Kb)
July 12, 1998 (14Kb)
July 10, 1998 (11Kb)
July 2, 1998 (83Kb)
July 1, 1998 (70Kb)
June 27, 1998 (50Kb)
June 25, 20:00 hrs
(21Kb)
June 25, 18:00 hrs
(70Kb)
June 24, 1998 (71Kb)
May 22, 1998 (21Kb) |
|
|
James
Bay, Quebec
Most recent image - August 7, 1998
(Full resolution, 14kb ppg)
See all thumbnails on one page. Warning:
Can be slow to load. |
|

 Location


